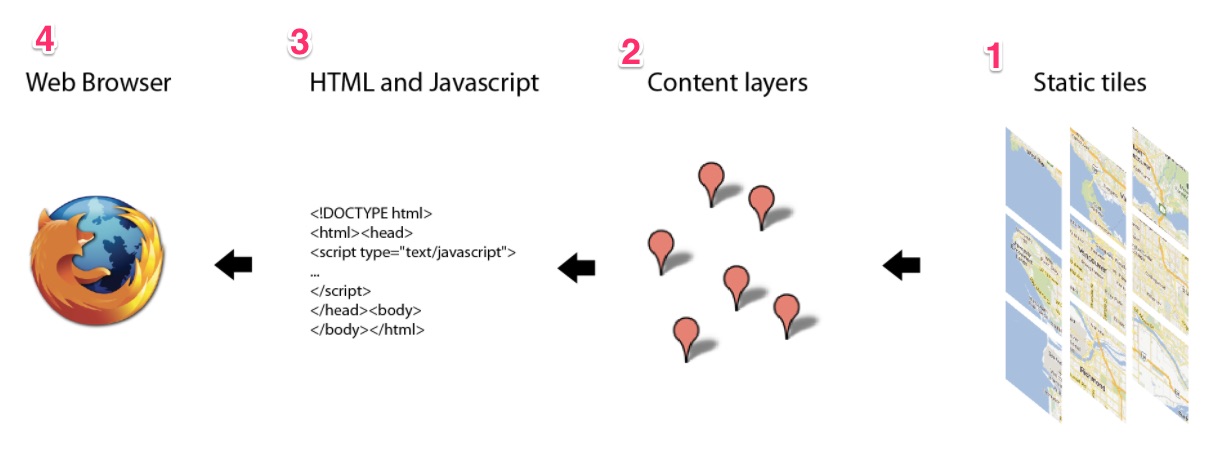
on commence par le navigateur et ses idées puis on travaille sur les 3 niveaux HTML/CSS/javascript/layers/basemap pour revenir au navigateur.
Ce post ne décrit que des solutions pour faire une narrative story map dans le but d'assurer une interopérabilité (import/export de content mais aussi de l'ensemble de la story).
Les libraries js de base ne sont pas concernées.
Leaflet.js (http://leafletjs.com/) y est souvent utilisé...
Voir ce post pour import/export des story map avec une liste exhaustive des solutions:
http://stephane-mottin.blogspot.fr/2016/11/faire-un-fichier-csv-ou-de-transcodage.html
On se focalise sur les événements utilisateurs ou javascript associés à la carte.
On ne traite pas de la basemap et du tuilage.
Au cas pour faire sa basemap:
http://www.maptiler.org/google-maps-coordinates-tile-bounds-projection/
Comparaison des librairies js pour l'interaction carte - utilisateur (click, hover, import/export/sharing de content).
Pour la liste des événements:
https://developers.google.com/maps/documentation/javascript/events
Pour les "info-windows"
https://developers.google.com/maps/documentation/javascript/infowindows
An InfoWindow displays content (usually text or images) in a popup window above the map, at a given location. The info window has a content area and a tapered stem. The tip of the stem is attached to a specified location on the map.
https://developers.google.com/maps/documentation/javascript/examples/infowindow-simple-max
Pour les basemaps et tiling (tuilage):
https://developers.google.com/maps/documentation/javascript/maptypes
Sinon pour l'URL d'entrée de cette documentation:
où on peut voir:
- Le tutoriel qui est très bon (en pas à pas) pour un débutant.
- "guide" pour les exemples expliqués pas à pas.
- "samples" pour les exemples que l'on peut directement tester dans jsfiddle.
Cependant il y qq exemples intéressant dans certains domaines:
Pour l'import
On a un choix avec des exemples superbes.
GeoJSON
https://developers.google.com/maps/documentation/javascript/examples/layer-data-dragndropData Layer: Drag and Drop GeoJSON
Pour utiliser cet exemple, faites glisser et déposez un fichier ou des fichiers GeoJSON de votre ordinateur sur la carte. Vous pouvez également faire glisser du texte ou du contenu HTML GeoJSON à partir d'un autre site Web ou de l'exemple ci-dessous.
To use this example, drag and drop a GeoJSON file or files from your computer on to the map. You can also drag text or HTML GeoJSON content from another website or from the sample below.
On peut faire la meme chose avec du "save" et plus d'outils avec http://geojson.io/
Mais ici on a le code source.
Rem: https://developers.google.com/maps/documentation/javascript/examples/layer-data-dynamic
On peut aussi écrire des lettres avec GeoJson (en fait des polygones)
et jouer avec les événements over et pop-up avec ces polygones-lettres-symboles.
GeoRSS (or KML)
GeoRSS via API flickr
with just one line:
var georssLayer = new google.maps.KmlLayer({
          url: 'http://api.flickr.com/services/feeds/geo/
?g=322338@N20&lang=en-us&format=feed-georss'});
pop-up with data from flickr (title, URL of the photographer, photo (click-> go to flickr), description)
In fact it's a KmlLayer. KmlLayer adds geographic markup to the map from a KML, KMZ or GeoRSS file that is hosted on a publicly accessible web server. A KmlFeatureData object is provided for each feature when clicked.
fusion table (to pop-pup)
le tutoriel (excellent):
Un exemple simple:
https://developers.google.com/maps/documentation/javascript/examples/layer-fusiontables-simpleChanger icone:
https://support.google.com/fusiontables/answer/2679986?hl=en
afficher un KML et des marqueurs en deux layers:
http://jackdougherty.github.io/fusion-point-polygon-list/index.html#
Voir aussi l'excellent site:
http://derekeder.com/searchable_map_template/
You want to put your data on a searchable, filterable map. This is a free, open source template to help you do it:
- clean, full-screen layout
- mobile- and tablet-friendly using responsive design
- address search (with variable radius)
- geolocation ("find me")
- RESTful URLs for sharing searches
- results count (using Google's Fusion Tables API)
- ability to easily add additional search filters (checkboxes, sliders, etc.)
- all done with HTML, CSS and Javascript - no server-side code required
mapping collaboratif
https://developers.google.com/maps/documentation/javascript/firebaseoutils firebase de Google
google "my maps"
Il n'y a pas d'API dédiée"my maps". C'est un web service mais avec des solutions d'import/export et de stockage très performant.There is no API for modifying the map of "my maps".
The KML/KMZ export provides a lightweight 'read only' API.
You can use these urls directly with kmllayer in the Javascript Google Maps API.
From February 2015, maps created in the classic Google Maps — https://maps.google.com/ — will no longer load KML/KMZ files from external websites. However, we know that KML files are a really useful way to work with geographic data, so we’ve added KML to Google My Maps, and continue to support this format with other Google Maps APIs. We hope that one of these options will meet your needs:
Google My Maps
Google My Maps is a powerful tool for easily creating custom maps to share and publish online. You can upload a KML file to My Maps, and display the map on your site with a simple HTML Embed code. Consider using My Maps if:
Google Maps JavaScript API
- Your data changes infrequently.
- You’d like access to a simple, WYSIWYG map editor.
- Your site displays fewer than 2500 maps per day.
- You can learn about uploading KML files to My Maps, and sharing a map on your site in our help center.
The Google Maps JavaScript API allows you to build rich and highly customizable maps applications/visualizations with your own content. Consider using the Maps JavaScript API for your map if:
- You display more than 2500 map per day.
- You are comfortable writing JavaScript.
- Your KML file contains features that My Maps is unable to display.
- The contents of your KML file change often.
- To learn more about displaying KML on a map with the Maps JavaScript API, please read our developer documentation, or check out these samples:
Ref: https://developers.google.com/maps/support/kmlmaps
My Maps: on peut aller dans ses outils Google par exemple Gmail et en haut à droite accéder à ses outils Google.
Choisir maps puis aller dans le menu en haut à droite. Choisir "your places".
puis aller dans "MAPS" en haut à droite.
C'est le service "google my maps".
Vos cartes sont "conservées/stockées "hosted" par Google.
On a un choix de 9 base map Google.
On peut faire un import quand on crée une layer:
https://support.google.com/mymaps/answer/3024925?visit_id=1-636160427321959393-939636062&p=lite_addplaces&rd=1
Vous pouvez importer un fichier CSV, TSV, KML, KMZ, GPX ou XLSX, ou une feuille de calcul à partir de Google Drive.
Remarque : Vous ne pouvez importer qu'un seul fichier de données (contenant jusqu'à 2 000 lignes) par calque.
Une autre fonction : {photos géo-taggées}->une carte
Si vous regardez l'aide en français, il manque des info:
https://support.google.com/mymaps/answer/3433053?hl=fr
en anglais:
https://support.google.com/mymaps/answer/3433053?hl=en
vous avez ce texte en plus:
Importing georeferenced photos:Avec cet import, on n'a pas 3 choix:
You can automatically make a map from photos in your Google account that are tagged with GPS data, like photos taken with most smartphones.
Create a new layer. Click Import. Select Photo albums.
Choose the photos you want to import and click Select.
Your photos will automatically be placed on the map and a thumbnail image will be created for each photo.
Note: When you add images to your map, a copy is made in My Maps. This means that if you delete or make changes to the original image after you add it to your map, these changes will not be reflected in your map.
- en upload de ses fichiers sur son ordi (que CSV, tableur, kml...)
- google drive (que CSV, tableur, kml...)
mais uniquement - your photos (de ses différents albums comme de ses blogspot, ou Google photos...). Il faut donc télécharger avant son album de photo géotaggées.
https://support.google.com/mymaps/answer/3109452?visit_id=1-636160428345705584-939636062&p=lite_kml&rd=1
avec deux choix:
- Keep data up to date with network link KML (only usable online)
- Export to a .KML file (for full icon support, use .KMZ).
With .KML, the icons are lost but .KMZ is a zipped version of .KML
Many Javascript can open .KML (not .KMZ):
http://stackoverflow.com/questions/35867793/using-kmz-file-in-leaflet-map
qq exemples
Customize map info windows:
Conclusion
Il n'y a pas d'exemple de "narrative story map" comme Mapbox ou CartoDB-Odyssey...C'est que du carte par carte. Pas de gestion d'une "story" ou d'une suite de carte.
Mapbox
Liste des exemples très imposante!
ici avec mapbox-gl.js:
https://www.mapbox.com/mapbox-gl-js/example/popup-on-hover/
https://www.mapbox.com/mapbox-gl-js/example/custom-marker-icons/
https://www.mapbox.com/mapbox-gl-js/example/playback-locations/
Play map locations as a slideshow
Autoplay the locations of boroughs in New York City.
On peut faire une visite avec des effets de déplacements/zoom en diaporama.
ici avec mapbox.js:
https://www.mapbox.com/mapbox.js/example/v1.0.0/scroll-driven-navigation/
<link href='https://api.tiles.mapbox.com/mapbox-gl-js/v0.16.0/mapbox-gl.css' rel='stylesheet' />
style de
new mapboxgl.map
style: 'mapbox://styles/mapbox/basic-v8'
C'est basé partiellement sur https://www.mapbox.com/mapbox-gl-js/example/scroll-fly-to/
en ce décembre 2016, v 0.28.0:
'https://api.tiles.mapbox.com/mapbox-gl-js/v0.28.0/mapbox-gl.js'
et sur style de
new mapboxgl.map
style: 'mapbox://styles/mapbox/streets-v9',
-----
On peut aussi voir:
https://github.com/JackDougherty/mapbox-storymap
il détaille les inconvénients de mapbox.
Très bon exemple:
http://jackdougherty.github.io/mapbox-storymap/pulse.html
(https://api.tiles.mapbox.com/mapbox.js/v2.2.3/mapbox.js)
aussi avec mapboxGL:
http://jackdougherty.github.io/mapbox-storymap/index.html
https://github.com/JackDougherty/mapbox-storymap
https://api.tiles.mapbox.com/mapbox-gl-js/v0.12.2/mapbox-gl.js
utilise leaflet.js à la place de mapbox.js mais garde mapbox GL (bof en beta):
http://jackdougherty.github.io/mapbox-storymap/leaflet-only.html
if MapboxGL is new for you, but you have prior coding experience, read https://www.mapbox.com/help/mapbox-gl-js-fundamentals/
https://github.com/JackDougherty/leaflet-storymap
baselayers: image tiles that provide the foundation of the map. These tend to have a lot of data — a street map contains labels, buildings, and icons, details that wouldn’t work very well if they were rendered by browsers. Think L.mapbox.tileLayer in Mapbox.js and L.TileLayer in Leaflet.
overlays: these are often vector data like GeoJSON, encapsulated in layers like L.mapbox.featureLayer in Mapbox.js and L.geoJson in Leaflet. Relative to baselayers, they contain less information but are far more interactive: overlays can be changed in JavaScript and clicks on them can be detected and can trigger popups.
https://www.mapbox.com/mapbox-gl-js/
https://github.com/mapbox/mapbox-gl-js
Mapbox GL JS is a Javascript & WebGL library that renders interactive maps from vector tiles and Mapbox styles.
It is part of the Mapbox GL ecosystem which includes Mapbox GL Native, a suite of compatible SDKs for native desktop and mobile applications.
With Mapbox GL JS, a layer is a styled representation of vector or raster data. Each layer provides rules about how certain data should be drawn in the browser, and the renderer uses these layers to actually draw the map on the screen.
Because everything on the map is loaded as vectors in the browser, Mapbox GL JS has no distinction between baselayers and overlay layers. This means that map details like labels and icons and elements like streets and buildings can be modified with JavaScript, just like overlays in earlier mapping libraries. This also means that the functions and methods for changing and accessing styles of layers are a bit more detailed, as you will see in the sections below.
Mapbox GL JS is a JavaScript library that uses WebGL to render interactive maps from vector tiles and Mapbox styles. It is part of the Mapbox GL ecosystem, which includes Mapbox Mobile, a compatible renderer written in C++ with bindings for desktop and mobile platforms.
https://www.mapbox.com/mapbox-gl-js/plugins/
Mapbox.js
https://www.mapbox.com/mapbox.js/api/v3.0.1/
https://www.mapbox.com/api-documentation/#styles
The Mapbox Styles API lets you read and change map styles, fonts, and icons. This API is the basis for Mapbox Studio, our cartography software.
If you use Studio, Mapbox GL JS or the Mapbox Mobile SDKs, you're already using the Styles API.
This documentation is geared toward software developers who want to programmatically read & write these resources: it isn't necessary to read or understand this reference to design or use maps.
You'll want to be familiar with the Mapbox GL Style Spec to use this API: it defines the structure of map styles and is the open standard that helps Studio communicate with APIs and produce maps compatible with our libraries (like GL JS and Mobile). When we refer to style objects, they are objects that fit the Mapbox GL? Style Spec. You can see examples of these styles in our mapbox-gl-styles project, or you can create a new style? using Mapbox Studio.
The following styles are available to all accounts using a valid access token:
Sinon voir un post plus complet sur mapbox studio et mapbox.js (en anglais):
http://stephane-mottin.blogspot.fr/2016/11/mapbox-studio-mapboxjs-and-story-map.html
http://timemapper.okfnlabs.org/
et leur librairie JS:
https://github.com/okfn/timemapper
L'un des intérêts est le travail de fond de "open data, open content and open code"
de http://okfnlabs.org/ avec d'excellents codes et services:
http://frictionlessdata.io/data-packages/
http://okfnlabs.org/recline/demos/
ici avec mapbox-gl.js:
https://www.mapbox.com/mapbox-gl-js/example/popup-on-hover/
https://www.mapbox.com/mapbox-gl-js/example/custom-marker-icons/
https://www.mapbox.com/mapbox-gl-js/example/playback-locations/
Play map locations as a slideshow
Autoplay the locations of boroughs in New York City.
On peut faire une visite avec des effets de déplacements/zoom en diaporama.
ici avec mapbox.js:
https://www.mapbox.com/mapbox.js/example/v1.0.0/scroll-driven-navigation/
scroll-driven story map
Un exemple de story map (sans UI events)
avec mapbox.js:
Scroll-driven navigation with markers and a narrative
Scroll down the map to highlight a chapter in a story and pan the map to where the chapter took place on a map.
https://www.mapbox.com/mapbox.js/example/v1.0.0/scroll-driven-navigation/
<script src='https://api.mapbox.com/mapbox.js/v3.0.1/mapbox.js'></script>
<link href='https://api.mapbox.com/mapbox.js/v3.0.1/mapbox.css' rel='stylesheet' />
Un autre exemple superbe: une galerie Diaporama (Slideshow) dans un tooltip-marqueur et donc du UI events. On peut ajouter une personnalisation à son marqueur-tooltip.
https://www.mapbox.com/mapbox.js/example/v1.0.0/markers-with-image-slideshow/
En mettant les deux ensembles, on aurait donc une story map complète (attention: 5000 cartes/mois pour un compte free).
Avec Mapbox.js et MapBox GL.js
Voir une application avec qq ajouts et assez complète:
http://carlapedret.github.io/jewellerymap/
https://github.com/carlapedret
only copy/paste the example's html of mapbox.js (put in GitHub and after to github.io hosted pages http://carlapedret.github.io/jewellerymap/).
<script src='https://api.tiles.mapbox.com/mapbox-gl-js/v0.16.0/mapbox-gl.js'></script>avec mapbox.js:
Scroll-driven navigation with markers and a narrative
Scroll down the map to highlight a chapter in a story and pan the map to where the chapter took place on a map.
https://www.mapbox.com/mapbox.js/example/v1.0.0/scroll-driven-navigation/
<script src='https://api.mapbox.com/mapbox.js/v3.0.1/mapbox.js'></script>
<link href='https://api.mapbox.com/mapbox.js/v3.0.1/mapbox.css' rel='stylesheet' />
Un autre exemple superbe: une galerie Diaporama (Slideshow) dans un tooltip-marqueur et donc du UI events. On peut ajouter une personnalisation à son marqueur-tooltip.
https://www.mapbox.com/mapbox.js/example/v1.0.0/markers-with-image-slideshow/
En mettant les deux ensembles, on aurait donc une story map complète (attention: 5000 cartes/mois pour un compte free).
Avec Mapbox.js et MapBox GL.js
Voir une application avec qq ajouts et assez complète:
http://carlapedret.github.io/jewellerymap/
https://github.com/carlapedret
only copy/paste the example's html of mapbox.js (put in GitHub and after to github.io hosted pages http://carlapedret.github.io/jewellerymap/).
<link href='https://api.tiles.mapbox.com/mapbox-gl-js/v0.16.0/mapbox-gl.css' rel='stylesheet' />
style de
new mapboxgl.map
style: 'mapbox://styles/mapbox/basic-v8'
C'est basé partiellement sur https://www.mapbox.com/mapbox-gl-js/example/scroll-fly-to/
en ce décembre 2016, v 0.28.0:
'https://api.tiles.mapbox.com/mapbox-gl-js/v0.28.0/mapbox-gl.js'
et sur style de
new mapboxgl.map
style: 'mapbox://styles/mapbox/streets-v9',
-----
On peut aussi voir:
https://github.com/JackDougherty/mapbox-storymap
il détaille les inconvénients de mapbox.
Très bon exemple:
http://jackdougherty.github.io/mapbox-storymap/pulse.html
(https://api.tiles.mapbox.com/mapbox.js/v2.2.3/mapbox.js)
aussi avec mapboxGL:
http://jackdougherty.github.io/mapbox-storymap/index.html
https://github.com/JackDougherty/mapbox-storymap
https://api.tiles.mapbox.com/mapbox-gl-js/v0.12.2/mapbox-gl.js
utilise leaflet.js à la place de mapbox.js mais garde mapbox GL (bof en beta):
http://jackdougherty.github.io/mapbox-storymap/leaflet-only.html
if MapboxGL is new for you, but you have prior coding experience, read https://www.mapbox.com/help/mapbox-gl-js-fundamentals/
- no distinction between baselayers and overlay layers
- coordinates in lon,lat (like geoJson and xy coords); NOT lat,lng (like Leaflet, Mapbox.js)
https://github.com/JackDougherty/leaflet-storymap
-----
Traditional JavaScript map libraries often have two distinct categories of what are called “layers”:baselayers: image tiles that provide the foundation of the map. These tend to have a lot of data — a street map contains labels, buildings, and icons, details that wouldn’t work very well if they were rendered by browsers. Think L.mapbox.tileLayer in Mapbox.js and L.TileLayer in Leaflet.
overlays: these are often vector data like GeoJSON, encapsulated in layers like L.mapbox.featureLayer in Mapbox.js and L.geoJson in Leaflet. Relative to baselayers, they contain less information but are far more interactive: overlays can be changed in JavaScript and clicks on them can be detected and can trigger popups.
Mapbox GL JS et mapbox.js
Interactive vector maps in the browser, powered by WebGLhttps://www.mapbox.com/mapbox-gl-js/
https://github.com/mapbox/mapbox-gl-js
Mapbox GL JS is a Javascript & WebGL library that renders interactive maps from vector tiles and Mapbox styles.
It is part of the Mapbox GL ecosystem which includes Mapbox GL Native, a suite of compatible SDKs for native desktop and mobile applications.
With Mapbox GL JS, a layer is a styled representation of vector or raster data. Each layer provides rules about how certain data should be drawn in the browser, and the renderer uses these layers to actually draw the map on the screen.
Because everything on the map is loaded as vectors in the browser, Mapbox GL JS has no distinction between baselayers and overlay layers. This means that map details like labels and icons and elements like streets and buildings can be modified with JavaScript, just like overlays in earlier mapping libraries. This also means that the functions and methods for changing and accessing styles of layers are a bit more detailed, as you will see in the sections below.
Mapbox GL JS is a JavaScript library that uses WebGL to render interactive maps from vector tiles and Mapbox styles. It is part of the Mapbox GL ecosystem, which includes Mapbox Mobile, a compatible renderer written in C++ with bindings for desktop and mobile platforms.
https://www.mapbox.com/mapbox-gl-js/plugins/
Mapbox.js
https://www.mapbox.com/mapbox.js/api/v3.0.1/
mapbox studio
Remarque on peut aussi utiliser l'excellent mapbox studio qui ressemble à goggle "my maps" comme outils carte par carte.https://www.mapbox.com/api-documentation/#styles
The Mapbox Styles API lets you read and change map styles, fonts, and icons. This API is the basis for Mapbox Studio, our cartography software.
If you use Studio, Mapbox GL JS or the Mapbox Mobile SDKs, you're already using the Styles API.
This documentation is geared toward software developers who want to programmatically read & write these resources: it isn't necessary to read or understand this reference to design or use maps.
You'll want to be familiar with the Mapbox GL Style Spec to use this API: it defines the structure of map styles and is the open standard that helps Studio communicate with APIs and produce maps compatible with our libraries (like GL JS and Mobile). When we refer to style objects, they are objects that fit the Mapbox GL? Style Spec. You can see examples of these styles in our mapbox-gl-styles project, or you can create a new style? using Mapbox Studio.
The following styles are available to all accounts using a valid access token:
- mapbox://styles/mapbox/streets-v9
- mapbox://styles/mapbox/outdoors-v9
- mapbox://styles/mapbox/light-v9
- mapbox://styles/mapbox/dark-v9
- mapbox://styles/mapbox/satellite-v9
- mapbox://styles/mapbox/satellite-streets-v9
Sinon voir un post plus complet sur mapbox studio et mapbox.js (en anglais):
http://stephane-mottin.blogspot.fr/2016/11/mapbox-studio-mapboxjs-and-story-map.html
Un example de story map avec mapbox-gl.js et hébergement sur GitHub pages
The transformation of the Jewellery Quarter with mapbox.gl
This example uses api.tiles.mapbox.com/mapbox-gl-js/v0.16.0/mapbox-gl.js
Il semble qu'elle n'ait utilisé GitHub que pour l'hébergement de son html.
TimeMapper
on peut utiliser leur web service:http://timemapper.okfnlabs.org/
et leur librairie JS:
https://github.com/okfn/timemapper
L'un des intérêts est le travail de fond de "open data, open content and open code"
de http://okfnlabs.org/ avec d'excellents codes et services:
http://frictionlessdata.io/data-packages/
http://okfnlabs.org/recline/demos/
CartodDB et Odyssey.js
Liste des exemples:
voir les posts de ce blog (tag map ou GPS).
voir les posts de ce blog (tag map ou GPS).
relier la Visualisation CartoDB avec Odyssey.js
hélas l'utilisation de l'option vizjson dans la configuration de votre Odyssey.js markdown n'est plus active.
Avant il fallait aller dans votre CartoDB page et votre visualisation pour un click sur le "Share button" (en bas).
Hélas avec la V3 de de cartoDB.js (et builder; cartoDB est en v3.15 en oct 2016) et odyssey.js (qui date de 2013-2014), nous n'avons plus l'export comme dans
http://mapninja.github.io/CartoDB_Odyssey_Tutorial_for_Story_Maps/
https://carto.com/blog/map-of-the-week-an-odyssey-js-story-by-loomstate/
(un post de jul 2014)
https://github.com/JackDougherty/leaflet-storymap-odyssey
(polygone dans un viz.JSON fait dans cartoDB)
voir:
http://gis.stackexchange.com/questions/218606/is-there-a-way-to-get-a-viz-json-url-from-carto-builder
The CARTO Builder does not have the option to share the viz.json URL due to the current version of CARTO.js (v3.15) is not compatible with the Builder. The new version of CARTO.js (v4) will be released by March/April 2017 and it will be compatible with the CARTO builder.
https://carto.com/learn/guides/intro/migrating-from-carto-editor-to-carto-builder
MIGRATING FROM CARTO EDITOR TO CARTO BUILDER
Can I use CARTO Editor and CARTO Builder at the same time?
No, once CARTO Builder is enabled for your account, it is the only available map application.
Can I choose to use CARTO Editor instead?
No, CARTO Editor is currently in the process of being deprecated. All of the Editor features, and additional advanced functionality, is available within CARTO Builder. Once CARTO Builder is enabled for your account, the CARTO Editor is no longer available.
Avant il fallait aller dans votre CartoDB page et votre visualisation pour un click sur le "Share button" (en bas).
Hélas avec la V3 de de cartoDB.js (et builder; cartoDB est en v3.15 en oct 2016) et odyssey.js (qui date de 2013-2014), nous n'avons plus l'export comme dans
http://mapninja.github.io/CartoDB_Odyssey_Tutorial_for_Story_Maps/
https://carto.com/blog/map-of-the-week-an-odyssey-js-story-by-loomstate/
(un post de jul 2014)
https://github.com/JackDougherty/leaflet-storymap-odyssey
(polygone dans un viz.JSON fait dans cartoDB)
voir:
http://gis.stackexchange.com/questions/218606/is-there-a-way-to-get-a-viz-json-url-from-carto-builder
The CARTO Builder does not have the option to share the viz.json URL due to the current version of CARTO.js (v3.15) is not compatible with the Builder. The new version of CARTO.js (v4) will be released by March/April 2017 and it will be compatible with the CARTO builder.https://carto.com/learn/guides/intro/migrating-from-carto-editor-to-carto-builder
MIGRATING FROM CARTO EDITOR TO CARTO BUILDER
Can I use CARTO Editor and CARTO Builder at the same time?
No, once CARTO Builder is enabled for your account, it is the only available map application.
Can I choose to use CARTO Editor instead?
No, CARTO Editor is currently in the process of being deprecated. All of the Editor features, and additional advanced functionality, is available within CARTO Builder. Once CARTO Builder is enabled for your account, the CARTO Editor is no longer available.
odyssey sandbox et odyssey API
On a trois niveaux d'utilisation d'odyssey:
- http://cartodb.github.io/odyssey.js/documentation/#advanced-use-of-the-sandbox
le sandbox peut être considéré comme un web service clé en main
- http://cartodb.github.io/odyssey.js/documentation/#javascript-api
- le dupliquer dans GitHub: http://cartodb.github.io/odyssey.js/documentation/#contributing-code (on peut même ajouter des fonctions dans le sandbox) In order to have custom actions available in the Sandbox, add them in O.Template with the name and the action to be performed.
http://cartodb.github.io/odyssey.js/documentation/#popup
Il est donc possible d'ajouter des popups.
http://cartodb.github.io/odyssey.js/documentation/#audio
Il est donc possible d'ajouter du son (Actions to control HTML5 audio element).
pour les popups:
Creates actions to manage leaflet popups (http://leafletjs.com/reference.html#popup) or also called infowindows. It can be used as a leaflet plugin using actions attribute.
var map = new L.Map('map', {
center: [37, -91],
zoom: 6
});
var popup = L.popup().setLatLng(latlng).setContent('<p>popup for action1</p>')
O.Story()
.addState(O.Scroll().within($('#myelement'), popup.actions.openOn(map));
openOn(map)
Returns an action that opens the popup in the specified map see L.Popup.openOn documentation (http://leafletjs.com/reference.html#popup-openon).
https://github.com/CartoDB/odyssey.js/search?utf8=%E2%9C%93&q=leaflet
le sandbox peut être considéré comme un web service clé en main
How can I use CARTO.js and Mapbox.js together
https://carto.com/docs/faqs/other-technical-questions/
If you want to use all the features of CARTO (infowindows, legends, dynamic layers) with Mapbox basemaps, view the following example:
http://bl.ocks.org/javisantana/7200781
(avec viz.json de cartoDB)
If you want to use Mapbox.js features, and show a CARTO layer (without any CARTO feature), view the following example:
http://bl.ocks.org/javisantana/f485d193884983820cd3
Leaflet et ajouts
JackDougherty/leaflet-storymap (or mapbox) but no or small UI events on the map but you can add with js code (create new inputs in the CSV file)...
Scroll-driven story map, with point markers and narrative text in GeoJSON, using Leaflet and jQuery.
http://jackdougherty.github.io/leaflet-storymap/index.html
- Scroll-driven navigation, using screen swipe, trackpad, or keyboard down-arrow. Initial map displays all point markers.
- Viewers can pan and zoom the map independently of the narration, or click on any point to go directly to that chapter.
- Easy-to-learn template to create your own storymap. Upload text, point coordinates, zoom levels, and image links to a CSV generic spreadsheet, and drag into http://geojson.io to create a GeoJSON data file.
- Images can be stored in local subfolder or pulled from an external URL.
Due to GeoJSON data limitations, there is no easy way to insert hyperlinks inside the 'description' text. They must be created outside, in fields such as "source-link".
See some posts of this blog. I describe this small js. For example:
http://stephane-mottin.blogspot.fr/2016/12/analysis-of-js-create-your-own-storymap.html
The HTML code in the demo map is very well documented. if you have used Leaflet.js before then you should be easily able to use the template and even adapt it for your own use. The 'read me' file on leaflet-storymap's GitHub page also contains a number of useful links to other story map templates.
See also this tutorial:
Explore http://pembrokesoundscapes.ca/map, view code at https://github.com/rblades/rblades.github.io.
Added audio playback in the narrative, historical map layers.
a small javascript library: it creates HTML5 audio element and uses it to play mp3/ogg audio files.
It marks HTML elements with the ability to play a specified sound by hovering over or clicking the element.
https://loudlinks.rocks/
-----
with mapbox:
marker/pulse (animated) and 3 choices of basemap:
Avec un hoover en haut à droite:
https://github.com/jackdougherty/leaflet-map-polygon-hover
http://jackdougherty.github.io/leaflet-map-polygon-hover/index.html
https://www.datavizforall.org/leaflet/polygon-hover/
See some posts of this blog. I describe this small js. For example:
http://stephane-mottin.blogspot.fr/2016/12/analysis-of-js-create-your-own-storymap.html
The HTML code in the demo map is very well documented. if you have used Leaflet.js before then you should be easily able to use the template and even adapt it for your own use. The 'read me' file on leaflet-storymap's GitHub page also contains a number of useful links to other story map templates.
See also this tutorial:
Explore http://pembrokesoundscapes.ca/map, view code at https://github.com/rblades/rblades.github.io.
Added audio playback in the narrative, historical map layers.
a small javascript library: it creates HTML5 audio element and uses it to play mp3/ogg audio files.
It marks HTML elements with the ability to play a specified sound by hovering over or clicking the element.https://loudlinks.rocks/
-----
Quelques exemples de "code " pour leur propre story map développée par une personne
Interactive map for tracking gentrification in Bushwick, Brooklyn, NY.
Il a repris des parties d'odyssey.js. en y ajoutant d'autres briques (voir son GitHub), ce qui en fait un exemple très complexe mais aussi très complet y compris appart par appart.
C'est fait pour gérer une communauté urbaine...
Il a fait de nombreux outils:
par exemple pour gérer ses albums photos (et leur nom) et l'import cartoDB...
No comments:
Post a Comment