Showing posts with label tutorial. Show all posts

Wednesday, March 21, 2018

Samsung Tizen Studio or Gear Watch Designer ?

Gear Watch Designer  GWD

GWD is only for design (watch faces) 
without any UI and 0 interactivity.

Hardware


Low level (C/C++ and Tizen Studio)


prog=100Mo

Requirements

Microsoft Windows® 7 or later (32- or 64-bit), 
Apple Mac OS® X 10.8 (Mountain Lion) 64-bit or later

At least dual-core 2 GHz of CPU

At least 2 GB of RAM memory

At least 1 GB of free disk space

JRE (Java Runtime Environment) 1.8 or later. 32-bit JRE is required if you are use Windows.
(If you have trouble configuring the Java environment, see questions 18 and 20 in the FAQ)

The Gear’s simple home structure 

Understanding the Gear’s home structure is the key to designing engaging apps. The Gear’s simple home structure provides easy access to useful features. From the watch face that forms the center of this structure, users can access notifications, widgets, and the quick panel by swiping or rotating the bezel, and bring up the app list by pressing the Home key.


The watch face presents useful information as well as the current time. It is displayed whenever users turn on the Gear’s screen or press the Home key. Since users see the watch face most often, it should both provide useful information and satisfy the user's design tastes. While only one watch face can be used at a time, users can switch their watch face regularly.

The quick panel displays the current status and basic settings icons of Gear. Users access the quick panel from any screen by swiping down from the top of the screen, and adjust the settings by tapping the icons. The settings included in the quick panel are fixed by default.

Ref

http://developer.samsung.com/gear/design/structure

icons

App icons should be designed in a container to ensure consistency with other apps in the app list. We recommend using round container measuring 170x170 pixels. Icons in other sizes will be automatically resized when applied to the screen.
If an icon is not created with a round container, it will be reshaped. Depending on the dimensions of the icon, it will be cropped or reduced in size and placed in a gray container

Ref

http://developer.samsung.com/gear/design/visual-design/iconography

System font

The Gear uses Breeze Sans as the system font. Breeze Sans comes in light, regular, medium, bold, and condensed. The condensed option also comes in thin, light, regular, medium, and bold types. You can download Breeze Sans typeface:
  https://developer.tizen.org/design/platform/styles/typography

keyboard

Users can input text with an input delegator or a keyboard. Input delegators are used for suggestions, voice input, emojis, and handwriting. A keyboard is used when suggestions aren’t available or privacy is needed, like when you need to enter a password.
When the keyboard appears, the entry field is moved upward, so make sure that the location of the cursor remains visible on the screen. We also recommend letting longer phrases overflow to the left side of the screen so that users can revisit them by swiping over the entry field without leaving the keyboard.

Input delegators

App-provided suggestions

Users can select one of the suggestions provided by the app.

Voice

Users can input words with their voice.

Emoji

Users can select Unicode emoji.

Handwriting

Users can use a finger to input from the on-screen keyboard if the option is turned on in Settings.

Ref

http://developer.samsung.com/gear/design/patterns/input

Ref

http://developer.samsung.com/gear/design/watch-designer

---

Use GWD


gear watch designer BUILD PASSWORD troubleshooting

I went to Build it again and this is the message I get. Signing Fail Keystone Password was Incorrect. What does that mean? How can I fix it?
It's likely that the password to entered for the Author certificate is wrong. Try to regenerate the Author.p12 file with the correct password.

publish


Sunday, March 18, 2018

how to install (and debug and use and dvp u first "hello') TizenStudio to develop samsung for products on mac OSX sierra and later : example of Gear S, Gear S2, Gear Fit2, Gear S3, Gear Fit2 Pro and Gear Sport


INTRO on SAMSUNG GEAR SDK/IDE install

GEAR WATCH DESIGNER "NOW" COVERS ALL GEAR DEVICES (jan 2018)

Make your own Gear watch face in just a few steps on your Mac and PC.
Now available for Gear S, Gear S2, Gear Fit2, Gear S3, Gear Fit2 Pro and Gear Sport

For the example of Gear Fit2 Pro :
http://stephane-mottin.blogspot.fr/2017/12/samsung-gear-fit-2-pro-2017-sm-r365.html

The link for dvl:
http://developer.samsung.com/gear

1/ télécharger le SDK (win, ubuntu ou mac)

sur mac: web-ide_Tizen_Studio_2.2_usa_macos-64.dmg
500Mo

http://usa.sdk-dl.tizen.org/web-ide_Tizen_Studio_2.2_usa_macos-64.dmg

2/ on lance ce .dmg;

3/ error:


il faut java KDK ≥7

Et un bug! Aurait du prévenir que JDK≤8

il faut enlever 9.x si vous l'avez installé...
sudo rm -fr /Library/Java/JavaVirtualMachines/jdk-9.jdk/
sudo rm -fr /Library/Internet\ Plug-Ins/JavaAppletPlugin.plugin
sudo rm -fr /Library/PreferencePanes/JavaControlPanel.prefPane
Don't forget to check the
 /Library/Java/JavaVirtualMachines/ 
manually and see what your real JDK version is.

https://gist.github.com/schnell18/bcb9833f725be22f6acd01f94b486392

4/installer java JDK 8.

voir ci-dessous "tizen needs Java SE Development Kit 8u162"

5/install IDE de_Tizen_Studio_2.2_usa_macos-64.dmg


voir photo ci-dessus de présentation
653Mo !!!


Et après >1h pour ce manager,

on obtient:

Problems

Tizen studio 2.0 is not working on macOS Sierra.
The application is frozen on the workspace selection page and no button is clickable.
Tizen Studio freezes in "workspace launcher".

Open Terminal
Go to TizenStudio.app/Contents/MacOS
There may be the file named eclipse (binary file) (I'm not sure above path is correct , but you can find the file named eclipse which is binary around that location )
Execute Tizen Studio typing in as below
./eclipse -debug -consoleLog
Some log will be shown on the terminal

only one solution: downgrade to java 1.8.0_151 or 131...

https://developer.tizen.org/forums/sdk-ide/tizen-studio-2.0-not-working-on-macos-sierra


archive java JDK 8
http://www.oracle.com/technetwork/java/javase/downloads/java-archive-javase8-2177648.html
---

after debugging, the use of TizenStudio 2.2 and Tizen 4.0 platform (API 4.0)


Creating Your First Wearable Application
Creating Watch Faces
Creating Widget Applications (Widgets act as an informative and actionable shortcuts to applications)
Samples
https://developer.tizen.org/tizen/wearable

hello

change the "hello Watch" to hello xxxxx


Ref
https://developer.tizen.org/development/training/native-application/getting-started/creating-your-first-tizen-wearable-native-watch-application

Samples

all
https://developer.tizen.org/zh-hans/development/sample/native

examples digital clock
https://developer.tizen.org/zh-hans/development/sample/native/Clock/Digital_Watch
https://developer.tizen.org/zh-hans/development/api-references/native-application?redirect=/dev-guide/2.3.1/org.tizen.native.wearable.apireference/group__CAPI__WATCH__APP__MODULE.html&langredirect=1

examples analog clock

This sample application demonstrates how to create an analog watch with ambient mode support.
https://developer.tizen.org/zh-hans/development/sample/native/Clock/Analog_Watch

emulator for gear fit2

Till now (2018-01) there is no Emulator on Tizen Studio for Gear Fit series. 
But you may run your projects on Square Emulator in order to test Fit series projects. You can fix the resolution of your project from config.xml.
As the resolution of Gear Fit 2 is 216 x 432, i am setting height and width accordingly.
<?xml version="1.0" encoding="UTF-8"?>
<widget xmlns:tizen="http://tizen.org/ns/widgets" height="432" width="216" xmlns="http://www.w3.org/ns/widgets" id="http://yourdomain/XXXX" version="1.0.0"  viewmodes="maximized">
   ........
    <tizen:setting screen-orientation="portrait" context-menu="disable" background-support="disable" encryption="disable" install-location="auto" hwkey-event="enable"/>
</widget>
And taking the emulator having resolution 320 x 320 as there are no other square emulator option on the Tizen Studio. Hopefully this technique will solve your problem.

https://stackoverflow.com/questions/47883225/emulator-for-samsung-gear-fit-2-tizen
---

running on your watch

https://stackoverflow.com/questions/38549233/cant-connect-to-gear-s2-using-sdb
---
error SIGNATURE_VERIFICATION_FAILED[23] when running it.
pb certificate
http://developer.samsung.com/z/develop/getting-certificates/create

https://developer.tizen.org/zh-hans/forums/native-application-development/error-23-certificate-error-while-performing-native-demo-app?langswitch=zh-hans
From package manager "Extension SDK" , Check whether you have installed Samsung Certificate and Wearable extension or not . You have to install these two extensions.
http://imgur.com/a/xSaMN
http://imgur.com/a/cM4AV

you must create 
a Samsung publication certificate
AND a Tizen certificate

and It works!!!!

Just select not only the emulator but your device (device manager)...

In french, we say : OUF!

---

qq remarques en anglais sur le monde java et mac

http://osxdaily.com/2017/06/29/how-install-java-macos-high-sierra/

MacOS no longer ships with Java preinstalled (6.0), so you’ll need to download and install java on your own if you need it in MacOS 10.13 or 10.12. This is to insure that the most recent version of Java is installed on the Mac if it’s needed, aiming to lessen potential security issues that may come up with older versions of the Java software (though older versions of Java can be installed if need be for a specific reason).

Moreover think that  some parts of CS6 as Illustrator CS6 need legacy Java SE 6 runtime.
Then you must use terminal mode...
Adobe Illustrator CS6 with Java 8?

On my Mac, the creation of these directories
sudo mkdir /System/Library/Java/JavaVirtualMachines/1.6.0.jdk
sudo ln -s '/Library/Internet Plug-Ins/JavaAppletPlugin.plugin/Contents' /System/Library/Java/JavaVirtualMachines/1.6.0.jdk/Contents
sudo mkdir /System/Library/Java/Support/Deploy.bundle
alone allows me to run Illustrator CS 6 even when neither Java 6 nor Java 8 is installed. Apparently, Illustrator only checks for the presence of these directories to determine whether Java is installed (it actually launches even when java itself is absent, provided directories above are created). I would like to know, which functionality in Illustrator CS 6 actually requires Java, as it apparently can launch without it.
Note: On OS X 10.11 and later you'll need to disable System Integrity Protection from the Recovery HD using csrutil disable in Terminal. Have a look at: About System Integrity Protection on your Mac & How to Disable System Integrity Protection (rootless) in OS X El Capitan.


The latest version java LTS

The Version 8 Update 161
Release date January 16, 2018
https://www.java.com/en/download/
macOS Sierra 10.12 users: A few issues have been reported on Sierra. See FAQ for more information.
https://www.java.com/en/download/faq/sierra_java.xml
Java 8 is the long-term-support (LTS) version and Java 9 SE support ends March 2018; and Java 10 support is planned to start that month. Java 10 support ends prior to Java 11 that's planned for September 2018, and it will be the next LTS. 

The latest version of JDK

Java SE 9.0.4; 16 January 2018

The Java Development Kit (JDK) is an implementation of either one of the Java Platform, Standard Edition, Java Platform, Enterprise Edition, or Java Platform, Micro Edition platforms[1] released by Oracle Corporation in the form of a binary product aimed at Java developers on Solaris, Linux, macOS or Windows.

tizen needs Java SE Development Kit 8u162

http://www.oracle.com/technetwork/java/javase/downloads/jdk8-downloads-2133151.html

world of Java

https://en.wikipedia.org/wiki/Java_Development_Kit

Java SE Development Kit). For Java Developers. Includes a complete JRE plus tools for developing, debugging, and monitoring Java applications.

JRE:  Java Runtime Environment,
The JDK also comes with a complete Java Runtime Environment, usually called a private runtime, due to the fact that it is separated from the "regular" JRE and has extra contents. It consists of a Java Virtual Machine and all of the class libraries present in the production environment, as well as additional libraries only useful to developers, such as the internationalization libraries and the IDL libraries.

On 17 November 2006, Sun announced that they would release it under the GNU General Public License (GPL), thus making it free software (released by Oracle Corporation in the form of a binary product aimed at Java developers on Solaris, Linux, macOS or Windows. ).
https://en.wikipedia.org/wiki/Java_Development_Kit
http://www.oracle.com/technetwork/java/javase/downloads/index.html
http://www.oracle.com/technetwork/java/javase/downloads/jdk9-downloads-3848520.html


Friday, January 27, 2017

XML schema tutorial


An XML Schema describes the structure of an XML document.
The XML Schema Working Group is closed, having completed its work successfully. The specifications are now maintained by the W3C XML Core Working Group.
https://www.w3.org/XML/Schema

The XML Schema language is also referred to as XML Schema Definition (XSD).

The purpose of an XML Schema is to define the legal building blocks of an XML document:

  • the elements and attributes that can appear in a document
  • the number of (and order of) child elements
  • data types for elements and attributes
  • default and fixed values for elements and attributes

Why Learn XML Schema?

In the XML world, hundreds of standardized XML formats are in daily use.

Many of these XML standards are defined by XML Schemas.

XML Schema is an XML-based (and more powerful) alternative to DTD (Document Type Definition).

XML Schemas Support Data Types

One of the greatest strength of XML Schemas is the support for data types.
  • It is easier to describe allowable document content
  • It is easier to validate the correctness of data
  • It is easier to define data facets (restrictions on data)
  • It is easier to define data patterns (data formats)
  • It is easier to convert data between different data types

XML Schemas use XML Syntax

Another great strength about XML Schemas is that they are written in XML.

  • You don't have to learn a new language
  • You can use your XML editor to edit your Schema files
  • You can use your XML parser to parse your Schema files
  • You can manipulate your Schema with the XML DOM
  • You can transform your Schema with XSLT
  • XML Schemas are extensible, because they are written in XML.

With an extensible Schema definition you can:

  • Reuse your Schema in other Schemas
  • Create your own data types derived from the standard types
  • Reference multiple schemas in the same document

XML Schemas Secure Data Communication

When sending data from a sender to a receiver, it is essential that both parts have the same "expectations" about the content.

With XML Schemas, the sender can describe the data in a way that the receiver will understand.

Ref. http://www.w3schools.com/xml/schema_intro.asp
https://en.wikipedia.org/wiki/XML_schema

XSD How To?

XML documents can have a reference to a DTD or to an XML Schema.

A Simple XML Document

Look at this simple XML document called "note.xml":
<?xml version="1.0"?>
<note>
  <to>Tove</to>
  <from>Jani</from>
  <heading>Reminder</heading>
  <body>Don't forget me this weekend!</body>
</note>


The first line defines the note element to have four child elements: "to, from, heading, body".

An XML Schema

The following example is an XML Schema file called "note.xsd" that defines the elements of the XML document above ("note.xml"):
<?xml version="1.0"?>
<xs:schema xmlns:xs="http://www.w3.org/2001/XMLSchema"
targetNamespace="http://www.w3schools.com"
xmlns="http://www.w3schools.com"
elementFormDefault="qualified"
>


<xs:element name="note">
  <xs:complexType>
    <xs:sequence>
      <xs:element name="to" type="xs:string"/>
      <xs:element name="from" type="xs:string"/>
      <xs:element name="heading" type="xs:string"/>
      <xs:element name="body" type="xs:string"/>
    </xs:sequence>
  </xs:complexType>
</xs:element>

</xs:schema>


The note element is a complex type because it contains other elements.
The other elements (to, from, heading, body) are simple types because they do not contain other elements.

A Reference to an XML Schema

This XML document has a reference to an XML Schema:
<?xml version="1.0"?>

<note
xmlns="http://www.w3schools.com"
xmlns:xsi="http://www.w3.org/2001/XMLSchema-instance"
xsi:schemaLocation="http://www.w3schools.com note.xsd"
>

  <to>Tove</to>
  <from>Jani</from>
  <heading>Reminder</heading>
  <body>Don't forget me this weekend!</body>
</note>


Example
Here are some XML elements:
<lastname>Refsnes</lastname>
<age>36</age>
<dateborn>1970-03-27</dateborn>


And here are the corresponding simple element definitions:
<xs:element name="lastname" type="xs:string"/>
<xs:element name="age" type="xs:integer"/>
<xs:element name="dateborn" type="xs:date"/>


Example of an attribute
Here is an XML element with an attribute:
<lastname lang="EN">Smith</lastname>
And here is the corresponding attribute definition:
<xs:attribute name="lang" type="xs:string"/>

XSD Restrictions/Facets
Restrictions are used to define acceptable values for XML elements or attributes. Restrictions on XML elements are called facets.
Restrictions on Values
The following example defines an element called "age" with a restriction. The value of age cannot be lower than 0 or greater than 120:
<xs:element name="age">
  <xs:simpleType>
    <xs:restriction base="xs:integer">
      <xs:minInclusive value="0"/>
      <xs:maxInclusive value="120"/>
    </xs:restriction>
  </xs:simpleType>
</xs:element>


http://www.w3schools.com/xml/schema_intro.asp

XSD - The <schema> Element

The <schema> Element
The <schema> element is the root element of every XML Schema:
<?xml version="1.0"?>

<xs:schema>
...
...
</xs:schema>

http://www.w3schools.com/xml/schema_schema.asp

List of some XML Schema

Libraries

  • EAD, for encoding archival finding aids, maintained by the Technical Subcommittee for Encoded Archival Description of the Society of American Archivists, in partnership with the Library of Congress.
  • MARCXML, a direct mapping of the MARC standard to XML syntax.

Metadata
  • RDF - Resource Description Framework
  • ONIX for Books - ONline Information eXchange, developed and maintained by EDItEUR jointly with Book Industry Communication (UK) and the Book Industry Study Group (US), and with user groups in Australia, Canada, France, Germany, Italy, the Netherlands, Norway, Spain and the Republic of Korea.
  • DDML - reformulations XML DTD
  • PRISM - Publishing Requirements for Industry Standard Metadata (PRISM)
Publishing
  • JATS (formerly known as the NLM DTD)—Journal Article Tag Suite, a journal publishing structure originally developed by the United States National Library of Medicine
  • DITA—Darwin Information Typing Architecture, document authoring system
  • DocBook for technical documentation
  • PRISM - Publishing Requirements for Industry Standard Metadata (PRISM)
https://en.wikipedia.org/wiki/List_of_types_of_XML_schemas

XML Standards Library compilation
http://schemas.liquid-technologies.com/

TEI-XML

example HAL

https://github.com/CCSDForge/HAL/blob/master/Sword/COUV.xml

Friday, December 23, 2016

analysis of JS: create your own Storymap with leaflet and hosted by GitHub Pages


Scroll-driven story map, with point markers and narrative text in GeoJSON, using Leaflet and jQuery
https://github.com/jackdougherty/leaflet-storymap

Features

Scroll-driven navigation, using screen swipe, trackpad, or keyboard down-arrow. Initial map displays all point markers.
Viewers can pan and zoom the map independently of the narration, or click on any point to go directly to that chapter.
Easy-to-learn template to create your own storymap.
Upload text, point coordinates, zoom levels, and image links to a CSV generic spreadsheet, and drag into http://geojson.io to create a GeoJSON data file.
Images can be stored in local subfolder or pulled from an external URL.

Limitations

Due to GeoJSON data limitations, there is no easy way to insert hyperlinks inside the 'description' text. They must be created outside, in fields such as "source-link" (see below in "comment")

Requires open-source libraries

Now use the plugin leaflet.extra-markers to create a marker like this:

  // Creates a red marker with the coffee icon
  var redMarker = L.ExtraMarkers.icon({
    icon: 'fa-coffee',
    markerColor: 'red',
    shape: 'square',
    prefix: 'fa'
  });

  L.marker([51.941196,4.512291], {icon: redMarker,}).addTo(map);

Comments

The Leafet 1.x code includes a 'fly to' feature that animates the distance traveled from one map point to the next. Users with some coding skills can easily modify the background map, or add map overlays, or extend the code by adding new features.

Click on map.geoJSON. You can directly open the map in GitHub.

Click on map.CSV. You can directly open the tab in GitHub.

The structure of the HTML:
div "title"
div "narration"

  • "contents"
    • "space-at-the-top"
    • "container1"
    • "container2",  etc...
Dans chaque container1:
<div id="container1" class="image-container inFocus">
  • <p class="chapter-header">Hartford Public High School 1847</p>
  • <div class="img-holder"><img src="img/1847-HPHS-Catalog1904p164.jpg"></div>
    <a href="https://www.flickr.com/photos/56513965@N06/21047067205" target="_blank" class="source">
    Source: HPHS Quadrennial Catalogue 1904</a>
  • <p class="description">This scroll-driven storymap is built on an open-source Leaflet template. The design is ideal for telling a story that narrates different locations on a map. Or users can click any marker point to go directly to the chapter narrative.</p>
</div>

it's a small JS.

// create map
// loads the GeoJSON map data file from a local folder

  1.  // first, creates numerical icons to match the ID numbers avec ExtraMarkers.icon and put on the map (layer.setIcon)
  2. // creates the contents of each chapter from the GeoJSON data. Unwanted items can be removed, and new ones can be added. Rem: It's easy to add new structure.
  3. // Calculating total height of blocks above active
  4. Only one scroll for all slides (in "contents")
    Where there is an event  scroll of "contents", you have this js:
    $('div#contents').scroll(function() {
               if ($(this).scrollTop() >= areaTop && $(this).scrollTop() < areaBottom) {
                  $('.image-container').removeClass("inFocus").addClass("outFocus");
                  $('div#container' + feature.properties['id']).addClass("inFocus").removeClass("outFocus");

                  map.flyTo([feature.geometry.coordinates[1], feature.geometry.coordinates[0] ], feature.properties['zoom']);
                }
              });
  5. map.flyTo is only available with leaflet v1
    Sets the view of the map (geographical center and zoom) performing a smooth pan-zoom animation.
    http://leafletjs.com/reference-1.0.0.html#map-flyto
  6. end (initMap)

Tuto

Before you begin, review previous tutorials in this book:
  • Edit and Host Code Templates with GitHub
  • Create and Convert Map Data with GeoJson.io
Go to the GitHub repository template (https://github.com/jackdougherty/leaflet-storymap) and fork a copy of this repo to your own GitHub account. Requires signup for a free GitHub account. 
Reminder: if you have already forked one copy, go to your GitHub repository Settings to rename or delete the first copy, so that you may create a second copy.

Go to your copy on GitHub and click the "download" button to create a zipped (compressed) copy on your local computer. On most computers, double-click to unzip the folder.

The input

The map.csv file contains the map data in an easy-to-edit format. 

Open map.csv with any spreadsheet tool and replace the existing data with your own.

The structure is:
  1. id -- Assign numbers 1, 2, 3. . to each point, in desired order of appearance.
  2. chapter -- Add title for each section of the narrative.
  3. zoom -- Insert a zoom level for each chapter, usually between 11 (zoomed out) and 18 (zoomed in).
  4. image -- If storing images in local "img" folder, follow this format: img/photo1.jpg. Or if loading images from an external site, insert the full URL. Currently, images must be about 300px wide and roughly similar height.
  5. source-credit -- Add caption to credit the origin of the image. Write in this format: Source: ABC or leave blank if none.
  6. source-link -- Add a URL to make the source-credit appear as a hyperlink, or leave blank if none. (If you want a link in your text, you must put here)
  7. description -- Add text to display in the narrative. Currently, the length is not adjustable.
  8. lon and lat -- Insert the longitude and latitude coordinates of each point. 

To find coordinates in Google Maps, right-click any point and select What's Here. Reminder: Google Maps stores points in lat-lon format, but GeoJSON stores them in the reverse order (lon-lat, the same as X-Y coordinates in mathematics), so enter carefully into the map.csv spreadsheet.
Save the spreadsheet in CSV format. 

Open geojson.io in a browser.

Drag in the map.csv file to inspect your point data. 
To export, save in GeoJSON format, and the browser will download a file named: map.geojson.

Go to your forked repository of leaflet-storymap 

Go to your forked repository of leaflet-storymap in your GitHub.com account. Click on 'branches' and keep the master branch, but delete any others (such as gh-pages and/or dev).
In the master branch of your repo, click on Upload Files button, upload the two new files you created on your local computer, and replace the existing files with those names.
map.csv
map.geojson
  1. In your master branch, click on the index.html file, 
  2. click on the pencil icon to turn on the editor, and edit lines 7 and 22 to change the titles that will be displayed. 
  3. When done, scroll down and click the clean Commit Changes button to save your edits to the master branch.
Host your storymap code on the live web with GitHub Pages. At the top level of your repo on GitHub.com, select the master branch drop-down menu, and type in this new branch name: gh-pages. When you first create this branch, it contents may take several minutes to appear the first time on the public web, but updates will take only seconds to appear. Your public URL follows this format: http://USERNAME.github.io/REPO_NAME.
Learn more about how to edit your GitHub branches and make 'pull requests' to save changes from one branch to the other in the GitHub section in this book.

https://www.datavizforall.org/leaflet/storymap/#leaflet-point-storymap-with-scrolling-narrative


Thursday, December 22, 2016

GitHub, GitPages, GitBooks, Data Visualizalion, One Tool for Everything?


Sign up for a free GitHub account, a free multi-purpose tool that allows you to:

  • View and fork a copy of open-source code from other users
  • Make simple edits to your code directly in the browser
  • Share your code and receive or suggest revisions to others
  • Host a live version of your web code with GitHub Pages

a tutorial

https://www.datavizforall.org/edit/github/

and
 If you're already familiar with GitHub Pages, you may be interested to know that behind the scenes:
https://github.com/blog/2289-publishing-with-github-pages-now-as-easy-as-1-2-3

Wednesday, November 30, 2016

faire un fichier CSV ou de transcodage pour l'interopérabilité en vue de faire une "narrative story map"; Choix de la baseMap (tiles) dans odyssey.

Je ne détaillerai pas les différents posts de ce blog sur les histoires narratives cartographiées
utiliser les tags "map" ou "GPS"...

J'ai réalisé un programme pour faire le fichier/données/documents/récits de base et de conversion.

1/ étape flickr

Je télécharge mes images géo-taggées de ma ballade dans Flickr et je met mon choix dans un album
ou s'il y a trop de photos-slides de faire deux albums...

2/ étape écriture

puis un fichier  pour le récit
"name, description"
(name et description n'ont pas de ",")

3/étape transcodage 

  • le transcoder pour le format odyssey.js (ci-dessous)
  • le transcoder pour Story Map Tour (ci-dessous)

pour odyssey.js

les "live examples":
http://cartodb.github.io/odyssey.js/documentation/#the-odyssey-sandbox

le format d'une web slide=
#Adding images to your story
```
- center: [40.7365, -73.9982]
- zoom: 13
L.marker([40.7348, -73.9970]).actions.addRemove(S.map)
```
By default, images are also supported. 
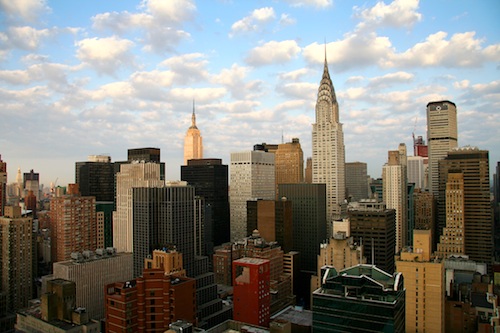
![New York](http://www.boston-discovery-guide.com/image-files/new-york-1.jpg "beautiful!")

Remarque: cette ligne de markdown produit ce code html:
<img src="URL.jpg" alt="New-York" title="beautiful!" />
Lorsque l'on passe la souris sur l'image le texte beautiful! apparait (c'est un hoover popup).
Donc pour chaque image il est préférable de prévoir 3 variable text.
De même pour un lien vers une URL.htm
[Markdown] (http://daringfireball.net/projects/markdown/] "title")
il n'y a pas de "!" pour une URL.htm.

NOTE: There is a known bug in Markdown.pl 1.0.1 which prevents single quotes from being used to delimit link titles.

De plus il est préférable avant la narration de préparer les cartes :
http://mapninja.github.io/CartoDB_Odyssey_Tutorial_for_Story_Maps/
  • Create an empty CartoDB table
  • Populate that table with fields for your data
  • Add the data to your new empty table
  • 'Geocode' your records so that they show up on the map
  • Customize the Pop-up and Hover doo-dads
  • Find your Map ID to put into Odyssey.js
  • Use the Odyssey.js 'Sandbox' to create a basic Story Map
  • Use an historic map from DavidRumsey.com as a basemap in your Story Map
  • Share your Odyssey.js Story Map with a URL, Embed Code, or host it yourself.
Hélas odyssey.js ne gère pas la carte de manière assez fine et repose sur deux 
points pour la carte
-baseurl
-vizjson
par exemple une "History of San Francisco" (que du "hover"):
pour, http://web.stanford.edu/~maples/maps/odyssey/odyssey.html

et pour un super tuto:
avec page "mapninja".github.io et son github: "github.com/mapninja"
https://github.com/mapninja/CartoDB_Odyssey_Tutorial_for_Story_Maps
et aussi son story map fait avec odyssey.js publié sur bl.ocks.org:
http://bl.ocks.org/anonymous/raw/409cb9de4c713e082dee/
il ya du hoover et aussi du popup.
tous ces événements sont dans le vizjson:
```
-baseurl: "http://georeferencer-0.tileserver.com//266b60e098fda1ddbe521ebff0e4d8676a549302/map/CGtnosESWB2NnsgVyjmQc5/201411301752-7AINSs/affine/{z}/{x}/{y}.png"
-title: "The Tattoo Map of San Francisco"
-author: "Stace Maples"
-vizjson: "https://stanfordgeo.cartodb.com/u/stacemaples/api/v2/viz/7840fa14-e940-11e4-bb41-0e49835281d6/viz.json"
```
Ils utilisent  un serveur de tuile pour les cartes anciennes:
http://www.davidrumsey.com/view/georeferencer

Pour renvoyer les informations "popup" suite à un événement click ou hover, c'est avec cartoDB.
Avec cartoDB, on peut choisir son format des data, par exemple:

Our blank table already has description and name fields, so we don't need to add those. We do want to add images to our pop-ups, as well as links our image sources and maybe even links to other websites with more information on the subject of the points we input. Let's add columns for those...
Add the following columns using the Add new column dialog box (just click the Add Column button again for each one):
  1. Description
  2. 'img_url1' with a type of 'string'
    (this will hold the URL for the image you want to show up in your pop-up)
  3. 'img_url1_src' with a type of 'string'
    (to hold the URL of the website you got the image from)
    If you want more than one image per pop-up, just add more sets of 'img_url#' and 'img_url#_src' columns, iterating the number (not too many, though, you'll be able to insert images into the narrative text of your Odyssey.js Story Map)
  4. 'link_url1' with a type of 'string'
    (This will hold a URL to link out to other sources of information)
  5. Again, if you want more links, just iterate the 'link_url#' column
  6. 'latitude' with a type of 'number'
  7. 'longitude' with a type of 'number'
Voir cet exemple avec google drive spreadsheets:

  • soit on exporte en .CSV (en le sauvegardant sur son ordi).
       puis on importe dans CartoDB. 
  • soit on importe directement ce fichier google drive (le nom du fichier est gardé; en fait il est importé en .CVS).
On obtient:


Attention cartoDB odyssey est  en (Lat, Long) par cette façon de rentrer les données 
(Rem: GeoJSON est en (Long,Lat)). 
Je vous conseille de mettre une colonne avec le titre The_geom et de mettre le string suivant avec ce format:
{"type":"Point","coordinates":[4.123694,45.142316]}
 avec en dernier la Longitude, ici 45.
Garder les deux colonnes séparées de chiffres avec les titres lo et la (pas Long ni Lat comme titre de colonne sinon cartoDB génère une erreur d'inversion) pour de futur interopérabilité de votre fichier excel.

Regarder votre data si tout va bien. Les titres doivent être en ASCII.
Il faut maintenant éditer une map (sur le bouton vert en bas à droite).
puis clicker sur le bouton (ici en vert):
puis choisir les effets pop-up (et legend) et aussi les styles des points


relier la Visualisation CartoDB avec Odyssey.js

La première des choses vise l'utilisation de l'option vizjson dans la configuration de votre Odyssey.js markdown. Ainsi vous avez besoin du JavaScript API URL de votre visualisation.

Il faut aller dans votre CartoDB page et votre visualisation pour un click sur le "Share button" (en bas).
Hélas avec la V3 de de cartoDB.js (et builder; cartoDB est en v3.15 en oct 2016) et odyssey.js (qui date de 2013-2014), nous n'avons plus l'export comme dans
http://mapninja.github.io/CartoDB_Odyssey_Tutorial_for_Story_Maps/
https://carto.com/blog/map-of-the-week-an-odyssey-js-story-by-loomstate/
(a post of jul 2014)
voir:
http://gis.stackexchange.com/questions/218606/is-there-a-way-to-get-a-viz-json-url-from-carto-builder

The CARTO Builder does not have the option to share the viz.josn URL due to the current version of CARTO.js (v3.15) is not compatible with the Builder. The new version of CARTO.js (v4) will be released by March/April and it will be compatible with the CARTO builder.

Changer de baseMap pour odyssey

On a de nombreux serveurs de baseMap:
http://wiki.openstreetmap.org/wiki/Tiles

On a 3 choix dans le sandbox d'odyssey: nokia est la moins mauvaise...
c'est l'ensemble des choix par défaut dans cartoDB editor:
  • https://cartocdn_a.global.ssl.fastly.net/base-light/{z}/{x}/{y}.png
    qui est vraiment très light!! mais "unlimited use permitted" et en lien avec OpenStreetMap.
  • une autre du provider Stamen: http://{s}.tile.stamen.com/watercolor/{z}/{x}/{y}.jpg
    essayez (chargement lent):
    http://tile.stamen.com/terrain/{z}/{x}/{y}.jpg
    http://maps.stamen.com/#terrain/12/37.7706/-122.3782
  • une autre du provider ex-nokia, maintenant HERE ("nokia day"):
    https://2.maps.nlp.nokia.com/maptile/2.1/maptile/newest/normal.day/{z}/{x}/{y}/256/png8?lg=eng&token=A7tBPacePg9Mj_zghvKt9Q&app_id=KuYppsdXZznpffJsKT24
    (vendu en 2015): https://wego.here.comhttps://fr.wikipedia.org/wiki/HERE_WeGo
    essayer le mode hybrid:
    "https://2.maps.nlp.nokia.com/maptile/2.1/maptile/newest/hybrid.day/{z}/{x}/{y}/256/png8?lg=eng&token=A7tBPacePg9Mj_zghvKt9Q&app_id=KuYppsdXZznpffJsKT24"
Rem:'http://{s}.somedomain.com/blabla/{z}/{x}/{y}.png'
{s} means one of the available subdomains (used sequentially to help with browser parallel requests per domain limitation; subdomain values are specified in options; a, b or c by default, can be omitted), {z} — zoom level, {x} and {y} — tile coordinates.
Ref: http://leafletjs.com/reference.html#popup

https://developer.here.com/rest-apis/documentation/enterprise-map-tile/
https://developer.here.com/rest-apis/documentation/enterprise-map-tile/topics/example-hybrid-map.html

vous pouvez aussi copier/coller celles-ci de cartoDB:
http://a.basemaps.cartocdn.com/light_all/{z}/{x}/{y}.png
http://a.basemaps.cartocdn.com/dark_all/{z}/{x}/{y}.png

le plus important est de bien choisir en fonction de ses besoins.
Personnellement je préfère openstreetmap car très complète:
http://{s}.tile.openstreetmap.org/{z}/{x}/{y}.png
et aussi une carte "france" :  http://{s}.tile.openstreetmap.fr/osmfr/{z}/{x}/{y}.png
http://wiki.openstreetmap.org/wiki/FR:Servers/tile.openstreetmap.fr
voir les choix:
http://leaflet-extras.github.io/leaflet-providers/preview/

Il faut comprendre qq différences avec "tileset":
A "tileset" typically includes enough tiles to form a very large image, if they were shown all at once, and also several zoom levels. Generally the idea is not to show them all at once, but to display a particular area of the map on a website. Normally this is done using a JavaScript map library to provide panning and zooming functionality, and request downloading of new tiles as necessary to show the user new areas of the map (a Slippy Map). (http://wiki.openstreetmap.org/wiki/Slippy_Map)
Faire sa baseMap personnalisée:

voir mon post:
http://stephane-mottin.blogspot.fr/2016/11/faire-un-fichier-csv-ou-de-transcodage.html


--------------


On peut aussi faire son propre tiling:
http://www.maptiler.org/google-maps-coordinates-tile-bounds-projection/

Il existe des outils de conversion entre le format X/Y/Z et TMS:
The difference between XYZ and TMS tiles and how to convert between them
https://gist.github.com/tmcw/4954720


https://en.wikipedia.org/wiki/Tiled_web_map

-----Rem:
On peut aussi changer l'apparence de la map avec les tests conditionnels du CSS via le zoom par exemple:
http://cartodb3.rssing.com/chan-32620984/all_p2.html
It is easy to change the content of your story map by using conditional zoom visualizations in the CartoDB CSS interface. Here is a snippet from the Berlin Map (https://carto.com/blog/berlin-wall-post/; https://gist.github.com/namessanti/e7432a85159fca12978e ; http://bl.ocks.org/namessanti/e7432a85159fca12978e )
we shared above:
line-opacity:1;[zoom=17]{polygon-fill:#F11810;polygon-opacity:0.4;}[zoom=15]{polygon-fill:grey;polygon-opacity:0.4;}[zoom=10]{polygon-fill:grey;line-color:#808080;}
This code changes the visualization at zoom level 17, 15, and 10 to represent the parameters identified below the [zoom = ] section.
When you bring your CartoDB map into Odyssey.js, those conditions remain on your map and make it easy to change the appearance of your map by simply moving the zoom and assigning a story panel. You can play around with all sorts of conditional CartoCSS parameters
https://github.com/mapbox/carto/blob/master/docs/latest.md

Si on veut plus, il faut un peu de code dans le config block.

Ref: http://mapninja.github.io/CartoDB_Odyssey_Tutorial_for_Story_Maps/

pour Story Map Tour (ESRI)

une web_slide= les colonnes suivantes avec un return à la fin:
name,description,icon_color,long,lat,pic_url,thumb_url,is_video
exemple:
Welcome to the reserve,
"The reserve is managed jointly. The Kendall Frost Mission Bay Reserve is part of the University of California Natural Reserve System (UC NRS) and is managed by the University of California San Diego (UCSD). The adjacent Northern Wildlife Reserve is managed by the City of San Diego. <i><a href=""http://nrs.ucsd.edu/kendall.html"" style=""color:yellow"" target=""_blank"">More Info</a></i>",
R,
-117.2296755,32.7920955,
http://downloads.esri.com/blogs/places/missionbaymarsh/marsh_intro_picture.jpg,
http://downloads.esri.com/blogs/places/missionbaymarsh/marsh_intro_picture_thumbnail.jpg,

avec au max 99 lignes.

le zoom (et centrage) sera à mettre slide par slide...

pour le javascript, on peut voir:

pour Story Map Knightlab

si on ne veut pas utiliser leur éditeur slide par slide, il faut plonger dans leur structure JSON.

La structure de la web_slide est:
{
    type: "overview",      // optional; if present must be set to "overview"
    location: {            // required for all slides except "overview" slide
        lat: decimal,      // latitude of point on map
        lon: decimal       // longitude of point on map
    },
    text: {                // optional if media present
        headline: string,
        text: string       // may contain HTML markup
    },
    media: {               // optional if text present
        url: string,       // url for featured media
        caption: string,   // optional; brief explanation of media content
        credit: string     // optional; creator of media content
    }
}
La structure de gestion de l'array de cet objet "slide" est:
{
    width: integer,                // required for embed tool; width of StoryMap
    height: integer,               // required for embed tool; width of StoryMap
    font_css: string,              // optional; font set
    calculate_zoom: true,              // optional; defaults to true.
    storymap: {
        language: string,          // required; two-letter ISO language code
        map_type: string,          // required
        map_as_image: false,       // required
        map_subdomains: string,    // optional
        slides: [object]           // required; array of slide objects (see below)
    }
}

Timeline Knightlab

Rem: l'utilisation de leur célèbre timeline est possible.
Elle se fait avec un fichier tableur
mais hélas les cartes sont à faire puis une URL dans une case du tableur...
Une carte par exemple une google map ou une cartoDB (avec l'excellent builder; voir ci-dessous), peut être mise sous forme de link_URL. 

le fichier tableur doit être stocké dans Google Drive, voir ici le template:

Year ,Month, Day, Time, End Year, End Month, End Day, End Time, Display Date, Headline, Text Media, Media Credit, Media Caption, Media Thumbnail, Type, Group, Background
soit 16 colonnes.
dans media ce sont des URL.
dans media caption: du texte ou par exemple <a href="http://www.flickr.com/photos/zachwise/6115056146/" title="Chicago by zach.wise, on Flickr">Chicago by zach.wise</a>


JackDougherty/leaflet-storymap or mapbox (2016)

Scroll-driven story map, with point markers and narrative text in GeoJSON, using Leaflet and jQuery.
https://github.com/jackdougherty/leaflet-storymap

  • Scroll-driven navigation, using screen swipe, trackpad, or keyboard down-arrow. Initial map displays all point markers.
  • Viewers can pan and zoom the map independently of the narration, or click on any point to go directly to that chapter.
  • Easy-to-learn template to create your own storymap. Upload text, point coordinates, zoom levels, and image links to a CSV generic spreadsheet, and drag into http://geojson.io to create a GeoJSON data file.
  • Images can be stored in local subfolder or pulled from an external URL.

Due to GeoJSON data limitations, there is no easy way to insert hyperlinks inside the 'description' text. They must be created outside, in fields such as "source-link".
Then there are no hover or popup events on the map...

The HTML code in the demo map is very well documented. if you have used Leaflet.js before then you should be easily able to use the template and even adapt it for your own use. The 'read me' file on  leaflet-storymap's GitHub page also contains a number of useful links to other story map templates.

with mapbox:
http://jackdougherty.github.io/mapbox-storymap/index.html

marker/pulse (animated) 3 choices of basemap:
http://jackdougherty.github.io/mapbox-storymap/pulse.html
no UI events on the map.

Examples with Added Features

Explore http://pembrokesoundscapes.ca/map, view code at https://github.com/rblades/rblades.github.io. Added audio playback in the narrative, historical map layers.
no UI events on the map.

Story Mapbox GL.js

A very quick way to create an effective scroll-driven story map is to use Mapbox GL. The advantage of using Mapbox GL over some other mapping libraries is that Mapbox GL allows you not only to zoom and pan the map but to rotate the map to provide different perspectives on your featured locations

If you want to create a Mapbox GL story map there is also the added advantage that Mapbox has provided a great template in their list of 'example' maps. The Fly to a location based on scroll position map in the Mapbox GL examples (https://www.mapbox.com/mapbox-gl-js/example/scroll-fly-to/) provides a neat demo of the possibilities of a Mapbox GL story map (all you have to do to create your own story map is copy & paste the provided code and change the content to suit the story you want to tell).
An example of story map (without UI events):
https://www.mapbox.com/mapbox.js/example/v1.0.0/scroll-driven-navigation/
An example: Slideshow gallery in a marker tooltip; Add a custom slideshow to a marker's tooltip.
https://www.mapbox.com/mapbox.js/example/v1.0.0/markers-with-image-slideshow/

This JavaScript library uses WebGL to render interactive maps from vector tiles and Mapbox styles. We found out how to to configure the color mapping on the client side and minimize data traffic while rendering a lot of data (https://www.ubilabs.net/en/news/data-driven-raster-layer-mapbox-lg-2016-09-05).

http://carlapedret.github.io/jewellerymap/
A beautiful example of a Mapbox GL story map is Birmingham Eastside's Gentrification in Birmingham’s Jewellery Quarter. Birmingham Eastside has used the Mapbox GL demo map to create a mapped guide to how gentrification is affecting Birmingham's Jewellery Quarter.
As you scroll through the map you are taken on a tour of the neighborhood, highlighting some of the biggest changes in the area. The Gentrification in Birmingham's Jewellery Quarter map also features map markers which provide another level of interactivity to the map. These markers provide additional information and media - such as audio recordings of interviews with some of the individuals featured in the side-panel content.
https://github.com/carlapedret
only copy/paste in html (in GitHub and after to github.io hosted pages http://carlapedret.github.io/jewellerymap/).

https://www.mapbox.com/bites/00110/
Mapbox have also used their own story map format to create a map of the intriguing case of Robert Durst. Durst was arrested on a first-degree murder warrant. If convicted he could face the death penalty.
Following the Life and Death of Robert Durst plots the key movements and actions of Robert Durst since his first wife 'disappeared' three decades ago up until his arrest in New Orleans. As well as the scroll-driven narration and up-dating map 'Following the Life and Death of Robert Durst' uses map markers and polylines to track Durst's movements around the country and to connect all the featured locations together.
-->no UI events on the map.


Ref: http://googlemapsmania.blogspot.fr/2016/08/mapbox-story-maps.html

Tools

---------------
Tools markdown/HTML
(Convert HTML to Markdown...)

Rem:
Remember that GeoJSON stores coordinates in "reversed order" (longitude, latitude)