Showing posts with label GeoJSON. Show all posts

Friday, January 13, 2017

DataCite (INIST, CERN). Metadata Schema. JAST, DOI. both human- and machine-readable metadata. embed the metadata using JSON and a script tag. The latter approach is easier to implement, as all metadata are in a single place, and the JSON can be embedded dynamically via a scrip.

Introduction

DataCite Metadata Schema
Documentation for the Publication and Citation of Research Data

https://www.datacite.org/

Members of the Metadata Working Group

Madeleine de Smaele, TU Delft (co‐chair of working group) Joan Starr,
California Digital Library (co‐chair of working group) Jan Ashton, British Library

Amy Barton, Purdue University Library
Tina Bradford, NRC/CISTI (New)
Anne Ciolek‐Figiel, Inist‐CNRS
Stefanie Dietiker, ETH Zurich (New)
Jannean Elliott, DOE/OSTI
Berrit Genat, TIB
Karoline Harzenetter, GESIS
Barbara Hirschmann, ETH Zurich (Departing)
Stefan Jakobsson, SND (New)
Jean‐Yves Mailloux, NRC/CISTI (Departing)
Lars Holm Nielsen, CERN (Departing)
Mohamed Yahia, Inist‐CNRS
Frauke Ziedorn, TIB (On leave, Metadata Supervisor)

resources

mainly a schema
https://schema.datacite.org/
The DataCite Metadata Schema is a list of core metadata properties chosen for an accurate and consistent identification of a resource for citation and retrieval purposes, along with recommended use instructions.

DataCite Metadata Working Group. (2016). DataCite Metadata Schema for the Publication and Citation of Research Data. Version 4.0. DataCite e.V. http://doi.org/10.5438/0013

many examples

https://schema.datacite.org/meta/kernel-4.0/

DOI

DataCite does not allocate DOIs directly; this activity is undertaken by many of DataCite’s members, who act as DOI allocating agents. DataCite members enable data owners, stewards, or archives to assign persistent identifiers to research data. The list below provides details and contact information for all of DataCite’s members.
INIST CNRS, CERN, CDL...
https://www.datacite.org/members.html

source code

The DataCite assets server.
https://github.com/datacite/segugio
This repository holds the official metadata schemas from DataCite as required by the DataCite Metadata Store.
https://github.com/datacite/schema

Uses the middleman static site generator
https://middlemanapp.com/

Using Schema.org for DOI Registration

a "post" of the DataCite blog : https://doi.org/10.5438/0000-00CC

Three weeks ago we started assigning DOIs to every post on this blog "https://blog.datacite.or" (Fenner, 2016c). The process we implemented uses a new command line utility and integrates well with our the publishing workflow, with (almost) no extra effort compared to how we published blog posts before.

Given that DataCite is a DOI registration agency, we obviously are careful about following best practices for assigning DOIs. DataCite focusses on DOIs for research data, but many of the general principles can also apply to blog posts. And we have learned a few things already.

Using schema.org metadata embedded in landing pages

Our initial implementation collected the metadata required for DOI registration in a way that is specific to a particular type of blogging software, so-called static site generators. While popular, this leaves out a large number of blogs, for example every blog hosted by Wordpress, by far the most popular blogging platform. We have now relaunched our blog to collect metadata differently, generic enough to work for any blog, but also well aligned with best practices for DOIs.

Our practice is that every DOI should resolve to a landing page, and that landing page should provide both human- and machine-readable metadata

Machine-readable metadata can be embedded into web pages in a number of ways. Traditionally this was done using HTML meta tags, more recent approaches to embedding metadata in HTML include microdata, microformats and RDFa. An alternative approach is to embed the metadata using JSON and a  script tag The latter approach is easier to implement, as all metadata are in a single place, and the JSON can be embedded dynamically via a script.

As for the vocabulary, the DataCite Metadata Schema has never been widely used for metadata embedded in web pages. Dublin Core Metadata (“Dublin Core Metadata Element Set, Version 1.1,” 2012) are often used for metadata in HTML meta tags. Schema.org is an initiative started in 2011 with many of the same goals as Dublin Core, namely to create, maintain, and promote schemas for structured data on the Internet.

(...)

DOI minting workflow

Publishing a blog post with embedded schema.org metadata, which is then used to mint a DOI and register DOI metadata, changes the DOI minting workflow for this blog. Although the publication workflow of a blog is much simpler than for peer-reviewed content, there are still three distinct phases:

  • post is drafted by author
  • post is shared for feedback with staff (and possibly others)
  • post is published

Blog posts in JATS XML

Blog posts are web pages and the landing page for the DOI also contains the fulltext of the post. But there are good reasons to make a blog post also available in downloadable form, most importantly to facilitate reuse, and for archiving. Journal Article Tag Suite (JATS) is an XML standard for tagging journal articles, used by the PubMed Central full-text archive of biomedical literature and by an increasing number of scholarly publishers.

JATS is an appropriate format for the blog posts of this blog, and starting this week all of our posts are also available in JATS XML format. You can see the download URL in the schema.org markup (the JATS for this post is here), we will add a more visible link to all posts once some minor tagging issues are resolved. We will also start registering the download URL with the DataCite MDS as media, making the JATS XML available to DOI content negotiation, and thus direct download. This should facilitate reuse by others, e.g. aggregation of content from multiple sources and display of content in different formats. This blog uses the Creative Commons Attribution license, allowing the copying, redistribution and remixing of the material in any medium or format for any purpose.


Monday, December 19, 2016

exemple de géo-données open data avec ANFR pour la localisation et détails sur les antennes "téléphone"


https://data.anfr.fr/page/home/

Formats de fichiers plats

CSV  Jeu de données entier   Seulement les 1 enregistrements sélectionnés
JSON  Jeu de données entier   Seulement les 1 enregistrements sélectionnés
Excel  Jeu de données entier   Seulement les 1 enregistrements sélectionnés

Formats de fichiers géographiques

GeoJSON  Jeu de données entier   Seulement les 1 enregistrements sélectionnés
Shapefile  Jeu de données entier   Seulement les 1 enregistrements sélectionnés
KML  Jeu de données entier   Seulement les 1 enregistrements sélectionnés

Thursday, December 8, 2016

GeoJSON, ce que vous ne pouvez faire GeoJSON et le problème de l'ordre latitude longitude des coordonnées sphériques


Le problème de l'ordre Longitude, Latitude ou Latitude, Longitude dans les données et les formats, est important.

Commençons par regarder le format GeoJSON. Comprendre ces concepts de format informatique/physique/mathématique/géomatique vous aidera à comprendre les données géospatiales en général: les concepts de base derrière GeoJSON ont été une partie de "geo" depuis le tout début.

La spécification GeoJSON elle-même est une spécification formelle d'un format assez lisible pour le javascript:
http://geojson.org/geojson-spec.html
GeoJSON (2008) is a geospatial data interchange format based on JavaScript Object Notation (JSON).
http://www.macwright.org/2015/03/23/geojson-second-bite.html

Ce que vous ne pouvez faire GeoJSON 

La popularité de GeoJSON dérive de sa simplicité, ce qui le rend facile à mettre en œuvre, à lire et à partager. Mais comme tous les autres formats, il a ses limites:
  • GeoJSON n’a aucune construction de topologie, que ce soit pour la compression, tels que TopoJSON ou sémantique, comme OSM XML et certains formats propriétaires. Une couche topologique sur GeoJSON est possible mais elle est restées lettre morte. 
  • "GeoJSON caractéristiques" ont des propriétés (features) qui sont de JSON. Ces features peuvent utiliser tous les types de données JSON : nombres, chaînes, tableaux null, booléens, et des objets. JSON ne supporte tous les types de données : par exemple, les valeurs de date sont prises en charge par Shapefiles, mais pas dans JSON. 
  • GeoJSON n’est pas une construction de style caractéristiques ou en spécifiant le contenu popup. Il y a des conventions folkloriques pour le faire, mais ceux-ci ne sont pas et ne sera pas dans la spécification. La plupart des formats de geo n’ont pas style. 
  • GeoJSON n’est pas un type de géométrie du cercle, ou n’importe quel type de courbe. Seuls quelques formats, comme WKT prend en charge les courbes et des cercles plutôt que des géométries linéaire. Cercles et courbes sont relativement difficiles à mettre en œuvre, car un cercle sur une planète de géoïde sphéroïde est beaucoup plus complex qu’un cercle sur une feuille de papier ;)
  • Positions n’ont pas des attributs. Si vous avez une représentation de LineString d'une course/ballade, et votre GPS montre connecté avec 1 000 points différents le long du parcours avec des données comme votre fréquence cardiaque et de la durée, hélas il n’y a aucune réponse claire pour la représentation de ces données. Vous pouvez stocker des données supplémentaires dans des positions coordonnées de quatrième et cinquième, ou dans les propriétés sous forme de tableau avec la même longueur que le tableau de coordonnées, mais aucune de ces options est supporté par l’écosystème des outils. La spécification de fonctionnalités simples, qui a directement inspiré GeoJSON et la plupart des formats SIG, ne supporte pas cette notion d’attributs-à-poste (voir les deux formats - GPX et OSM XML).

Latitude et Longitude

Une incohérence frustrante dans les logiciels géospatiaux (notamment de type mappage) est l'ordre des coordonnées.
Les coordonnées sont souvent représentées sous forme de tableaux, comme [45.1, 4.1.], au lieu d'objets, comme {lng: 4.1, lat: 45.1}. Cela laisse au développeur de déterminer si 45.1 est la longitude ou la latitude. Un choix place un point sur Lyon, et l'autre un emplacement profond dans la Somalie.
La latitude de la ville de Lyon est proche de 45. Le pole nord c'est Lat=90 et l'équateur c'est une Lat= 0.
La longitude "0.00" est lié à Greenwich (Lat 51.48; Lng 0.00) un quartier de Londres :
https://fr.wikipedia.org/wiki/Greenwich_(Londres)

Le système de référence de coordonnées (CRS) 

Le système de référence de coordonnées (CRS) d'un objet GeoJSON est déterminé par son membre 'crs'. Si un objet n'a pas de membre crs, son membre crs de l'objet parent ou grand-parent peut être acquis. Si aucun membre crs ne peut être ainsi acquis, le CRS par défaut s'appliquera à l'objet GeoJSON.
Le CRS par défaut est un système de référence de coordonnées géographiques, utilisant le datum WGS84, et avec des unités de longitude et de latitude de degrés décimaux.
https://fr.wikipedia.org/wiki/WGS_84

GeoJSON (ici minimaliste) pour un point situé sur Fourvière à Lyon:
{
  "type": "FeatureCollection",
  "features": [
    {
      "type": "Feature",
      "properties": {},
      "geometry": {
        "type": "Point",
        "coordinates": [
          4.8264312744140625,
          45.76581655469703
        ]
      }
    }
  ]
}
GeoJSON a un ordre = Longitude,Latitude

L'ordre latitude longitude ou l'inverse

Il ya un certain consensus croissant autour de l'ordre (longitude, latitude) pour les formats géospatiaux, mais hélas c'est toujours le chaos pour les bibliothèques et les logiciels. Il appartient au développeur d'être conscient de ce problème et de lire la documentation requise, surtout de déplacer les coordonnées si nécessaire pour traduire entre différents systèmes:


La tradition géographique favorise lat, lon mais les mathématiques et souvent les logiciels préfèrent l'ordre lon, lat...
L'utilisation des coordonnées sphériques différent suivant les domaines.
En physique c'est "(r, θ, φ)" avec la distance radiale, l'angle dans le plan équateur, puis l'angle azimuthal.
En mathématiques "(r, θ, φ)" avec la distance radiale, l'angle azimuthal puis l'angle dans le plan équateur.
En fait il existe un ISO standard 80000-2 :2009 pour l'ordre des angles (item 2-16.3 coordinate systems: spherical coordinates). La latitude est en premier.
Hélas cet angle "latitude" mathématique est égal à 0 au "pôle nord" (par rapport à l'axe zenith ou z axis en coordonnées euclidiennes). Il est noté :


L'angle entre l'axe et le plan équateur est dans la borne: [0,π].
L'angle dans le plan équateur (perpendiculaire à l'axe zenith) est dans la borne:  [0,2π[.

Qu'en est-il de GPX ou OSM XML? 

Les formats qui représentent lat et lon avec des attributs XML distincts et n'imposent aucun ordre de coordonnées, car les attributs XML ne sont pas ordonnés...

Ref: en anglais  http://www.macwright.org/lonlat/

Tuesday, December 6, 2016

Hofstra tools: story map and Web based mapping tools for teaching and research


http://hofstra.github.io/itinerary/plague-year/

https://github.com/hofstra/itinerary#fork-destination-box

2 working demonstrations using mapping technology to navigate historical data or literature:

  • "Plague Year," which provides a timeline-based navigation tool to step through events recorded from Defoe's A Journal of the Plague Year.
  • Melville in Rome, which enables the exploration of possible routes taken by Melville in between events recorded in his journal of his time spent there.
use of :
https://api.tiles.mapbox.com/mapbox.js/v2.1.5/mapbox.js


a-frightful-number-plague is the name of a CSV file in the _data folder, for this project.
This Jekyll variable (events) is used in the body of this document to render the itinerary table.
The CSV file referenced above generates HTML in the body of this document as well as a JSON data file referenced by JavaScript code.

Friday, December 2, 2016

Liste des serveurs de baseMap (tiles, tuillage et layers). Changer de baseMap (et la personnaliser) pour odyssey.js: mapbox.

Les tuiles:
puis les zooms:


La base:

En français:
http://openstreetmap.fr/blogs/cquest/visite-guidee

https://switch2osm.org/fr/les-basiques/

Servir des tuiles:
https://switch2osm.org/fr/servir-des-tuiles/utilisation-dune-solution-tout-en-un/

les serveurs:
http://wiki.openstreetmap.org/wiki/Tile_servers

Le format principal (pour X/Y/Z) est une URL de ce type:
'http://{s}.somedomain.com/blabla/{z}/{x}/{y}.png'
{s} means one of the available subdomains (used sequentially to help with browser parallel requests per domain limitation; subdomain values are specified in options; a, b or c by default, can be omitted), {z} — zoom level, {x} and {y} — tile coordinates.

tile server capable of providing map tiles in vector (pbf) or raster (png) formats, as well as static map snapshots of any size for a given location.

Une liste de serveurs
The maps project aims to build cartography technologies for all Wikimedia projects, at a scale sufficient for their widespread usage. 
https://www.mediawiki.org/wiki/Maps
https://www.mediawiki.org/wiki/Maps#/map/0
On peut comparer: Bing Maps, Google Maps, OpenStreetMap,ACME Mapper,Apple Maps,HERE, MapQuest,Waze, Wikimapia, WikiMiniAtlas, Yandex.Maps.
http://tile.openstreetmap.fr/?q=yssingeaux
http://mapper.acme.com/?ll=45.142316,4.123694&z=10&t=M&marker0=45.142316,4.123694,Maps

Serveurs

On a de nombreux serveurs de baseMap:
http://wiki.openstreetmap.org/wiki/Tiles

Il faut comprendre qq différence avec "tileset":
A "tileset" typically includes enough tiles to form a very large image, if they were shown all at once, and also several zoom levels. Generally the idea is not to show them all at once, but to display a particular area of the map on a website. Normally this is done using a JavaScript map library to provide panning and zooming functionality, and request downloading of new tiles as necessary to show the user new areas of the map (a Slippy Map). (http://wiki.openstreetmap.org/wiki/Slippy_Map)

Changer de baseMap pour odyssey.js

On a de nombreux serveurs de baseMap:
http://wiki.openstreetmap.org/wiki/Tiles

On a 3 choix dans le sandbox d'odyssey: nokia est la moins mauvaise...
c'est l'ensemble des choix par défaut dans cartoDB editor free:
  • https://cartocdn_a.global.ssl.fastly.net/base-light/{z}/{x}/{y}.png
    qui est vraiment très light!! mais "unlimited use permitted" et en lien avec OpenStreetMap.
  • une autre du provider Stamen: http://{s}.tile.stamen.com/watercolor/{z}/{x}/{y}.jpg
    essayez (chargement lent):
    http://tile.stamen.com/terrain/{z}/{x}/{y}.jpg
    http://maps.stamen.com/#terrain/12/37.7706/-122.3782
  • une autre du provider ex-nokia, maintenant HERE ("nokia day"):
    https://2.maps.nlp.nokia.com/maptile/2.1/maptile/newest/normal.day/{z}/{x}/{y}/256/png8?lg=eng&token=A7tBPacePg9Mj_zghvKt9Q&app_id=KuYppsdXZznpffJsKT24
    (vendu en 2015): https://wego.here.comhttps://fr.wikipedia.org/wiki/HERE_WeGo
    essayer le mode hybrid:
    "https://2.maps.nlp.nokia.com/maptile/2.1/maptile/newest/hybrid.day/{z}/{x}/{y}/256/png8?lg=eng&token=A7tBPacePg9Mj_zghvKt9Q&app_id=KuYppsdXZznpffJsKT24"
Rem:'http://{s}.somedomain.com/blabla/{z}/{x}/{y}.png'
{s} means one of the available subdomains (used sequentially to help with browser parallel requests per domain limitation; subdomain values are specified in options; a, b or c by default, can be omitted), {z} — zoom level, {x} and {y} — tile coordinates.
Ref: http://leafletjs.com/reference.html#popup

https://developer.here.com/rest-apis/documentation/enterprise-map-tile/
https://developer.here.com/rest-apis/documentation/enterprise-map-tile/topics/example-hybrid-map.html

vous pouvez aussi copier/coller celles-ci de cartoDB:
http://a.basemaps.cartocdn.com/light_all/{z}/{x}/{y}.png
http://a.basemaps.cartocdn.com/dark_all/{z}/{x}/{y}.png

le plus important est de bien choisir en fonction de ses besoins.
Personnellement je préfère openstreetmap car très complète:
http://{s}.tile.openstreetmap.org/{z}/{x}/{y}.png
et aussi une carte "france" :  http://{s}.tile.openstreetmap.fr/osmfr/{z}/{x}/{y}.png
http://wiki.openstreetmap.org/wiki/FR:Servers/tile.openstreetmap.fr
voir les choix:
http://leaflet-extras.github.io/leaflet-providers/preview/

Il faut comprendre qq différence avec "tileset":
A "tileset" typically includes enough tiles to form a very large image, if they were shown all at once, and also several zoom levels. Generally the idea is not to show them all at once, but to display a particular area of the map on a website. Normally this is done using a JavaScript map library to provide panning and zooming functionality, and request downloading of new tiles as necessary to show the user new areas of the map (a Slippy Map). (http://wiki.openstreetmap.org/wiki/Slippy_Map)

Faire sa basemap personnalisée avec MapBox utilisable par odyssey.js

On peut utiliser le provider mapbox (https://www.mapbox.com) mais attention au mélange:
Mapbox is a service which lets you customize the design of a basemap with custom colors and elements. Insert your Mapbox URL and access token to add the basemap
Note: CARTO only supports Mapbox classic urls. If you enter a new Mapbox Studio url, an error appears.
En premier, avec odyssey.js, on peut utiliser les baseMaps styles de base de mapBox comme la "mapbox.streets":
https://api.mapbox.com/v4/mapbox.streets/{z}/{x}/{y}.png?access_token=your_token
voir: https://carto.com/location-data-services/basemaps/
https://carto.com/docs/carto-editor/maps/#basemaps

On a deux choix:

  • soit avec les superbes outils javascript de MapBox
  • soit avec MapBox Studio.

Je vais traiter du cas avec "MapBox Studio" (et en lien avec la doc/exemple javascript).
MapBox n'est pas facile à comprendre au début.
C'est un processus linéaire :
                                            datasets->tilesets->Styles
                                            en fait (GeoJSON data->layer vectorielle->carte multicouche).

  1. Il faut se créer un compte et on obtient une clé (token).
    Il faut savoir que c'est construit "on top of Leaflet" http://leafletjs.com/
    ->plus de renseignement: GitHub: https://github.com/mapbox/mapbox.js/
  2. importer un dataset (voir point 3). Juste une explication: c'est fondée sur les fonctions import/export liées au Leaflet-Omnivore plug-in
    https://api.mapbox.com/mapbox.js/plugins/leaflet-omnivore/v0.2.0/leaflet-omnivore.min.js. qq exemples:
  3. avec MapBox Studio, il suffit de faire "new datasets", soit on le créée soit on l'upload, avec ces deux choix (tester son fichier avec geojson.io, avant):
    • GeoJSON 
    •  CSV file
  4. on click sur datasets (à gauche) puis "edit", on peut voir son fichier sur une carte et aussi en un click sur un point (ou plusieurs points) l'ensemble des données associés.
    On peut ajouter une droite, un polygone, un point... Si on revient sur dataset, on peut sauvegarder en geoJSON son oeuvre modifiée.
  5. exporter vers "tilesets"
  6. dans tilesets, on peut voir la nature de cette "carte", par exemple: "This layer contains mostly Points". On a le numero "mapId" le format "pbf" vector et sa taille. C'est en fait une vector layer (générée à partir de l'ensemble des données GeoJSON). De plus on peut suivre les stats de visualisation de sa carte.
    Avec un compte gratuit: 50 000 map views/mois ou 50 000 mobile users/mois (en décembre 2016); 600 geocode requests/minute, 5 GB tileset storage, 250 MB dataset storage, 20 Mapbox Studio styles. Cet ensemble de limite est le principal défaut de l'hébergement/usage sur mapBox. Sinon on a accès à tout le reste  (Geocoding,  Satellite & street maps, full Mapbox Studio, Directions, les librairies javascripts).
    A map view is 
    • four map tiles when using Mapbox Studio styles, or 
    • 15 smaller map tiles when using Mapbox Studio Classic or Mapbox Editor Classic. 
    • One Static API request also counts as one map view.
  7. faire "add to style". Vous avez enfin votre solution où vous pouvez tout personnaliser.vous avez le lien vers ce style de type:
    https://www.mapbox.com/studio/styles/username/mapId/
    avec votre username et votre mapid.
    Si vous avez choisi la base: "Mapbox Streets V7 + Vector Terrain V2(Composite source)"
    vous aurez un très grand choix des layers (à afficher ou non). Pour l'instant allons dans le symbol "menu" juste à droite du bouton "edit" et sélectionner "share". 
  8. Les 4 choix du sharing/partage:
    1. faire un lien (URL) .html (la carte est déplaçable, zoomable et on a la rotation du plan)
      par contre on a un gros logo en haut à droite pas beau...
    2. "Develop with this style"
      1. mapbox: pour utiliser avec leur librairie javascript; voir exemple:
        https://www.mapbox.com/mapbox-gl-js/example/setstyle/
        Cet exemple permet aussi de comparer les styles de base de mapbox.
      2. leaflet:
        https://api.mapbox.com/styles/v1/stef4250/ciw6uszpd000e2pmkuzzzqlln/tiles/256/{z}/{x}/{y}?access_token=XXmyTokenXX
        C'est cette URL de tuiles qu'il faut utiliser pour odyssey.jspour avoir une carte personnalisée (et avec un import/export interopérable)
        http://leafletjs.com/reference.html#tilelayer
        Voir les nombreuse options...
        Used to load and display tile layers on the map, implements ILayer interface:
        L.tileLayer('http://{s}.tile.osm.org/{z}/{x}/{y}.png?{foo}', {foo: 'bar'}).addTo(map);
        dans odyssey.js:
        var baseurl = this.baseurl = 'http://{s}.api.cartocdn.com/base-light/{z}/{x}/{y}.png';
        var
        basemap = this.basemap = L.tileLayer(baseurl, { attribution: 'data OSM - map CartoDB'}).addTo(map);
        Rem: C'est ici qu'est inséré    comme attribution le string  'data OSM - map CartoDB'
      3. on peut personnaliser ses "points"
        • Title                    Eglise
        • marker-color       #7e7e7e
        • marker-size         medium
        • marker-symbol  village

Add your map style as a layer in ArcGIS and QGIS with WMTS:
https://www.mapbox.com/help/mapbox-arcgis-qgis/

Outils

Faire son tuillage

On peut aussi faire son propre tiling:

outils de conversion entre le format X/Y/Z et TMS

Il existe des outils de conversion entre le format X/Y/Z et TMS:
The difference between XYZ and TMS tiles and how to convert between them

ajout de layers

Par exemple avec google fusion:

design a specific layer-basemap

Most web maps are made up of many small, square images called tiles. These tiles are typically 256×256 pixels and are placed side-by-side in order to create the illusion of a very large seamless image. There are several different tiling schemes, but among the most popular is the standard XYZ tile scheme, used by Google, OpenStreetMap, CARTO, Mapbox, and others. Tile images are are served through a REST API with a URL like http://.../Z/X/Y.png, where Z is the zoom level, and X and Y identify the tile.
Mapbox now supports directly accessing raster tile endpoints for Mapbox studio styles. This means you can design custom maps in Mapbox Studio and access them directly in Fulcrum!
From the Styles page in Mapbox Studio, click on either a Mapbox style or one of your own custom styles.
Scroll down the style page until you see the “Use style in GIS apps” section and click on the CARTO tab (Fulcrum uses the same scheme as CARTO).
Copy the Integration URL and proceed with adding the map layer to Fulcrum.


----------

Wednesday, November 30, 2016

analysis VIZJSON and odyssey.js, cartoDB.js: story map


VizJSON is a markup language for describing charts to a rendering engine such that the engine can interpret the associated data and display it in a chart. It is similar in concept to HTML in that HTML is a common markup language that browsers can interpret and use to display web pages. Think of it this way: VizJSON is for visualization renderers as HTML is for browsers. This article describes the advantages of an open language (such as VizJSON) for describing visualization. This language can serve as the foundation of new open-source software that produces and consumes VizJSON as the descriptive language of visualization.
VizJSON is a language-based specification of a visualization data model based on The Grammar of Graphics (see Resources) and expressed in JavaScript Object Notation (JSON). The Grammar of Graphics describes the rules that connect data and graphics. The ideas behind this book have influenced statistical software such as R and SPSS. (See Resources to more about R and SPSS.)

Ref: http://www.ibm.com/developerworks/library/bd-vizjson/

For map


A viz.json is a file that contains all the data needed to reproduce the visualization you created in CartoDB.
The CARTO's viz.json file tells CARTO.js all the information about your map, including the style you want to use for your data and the filters you want to apply with SQL. The viz.json file is served with each map you create in your CARTO account.
Although the viz.json file stores all your map settings, all these settings can be easily customized with CARTO.js. If you want to modify the result after instantiating your map with the viz.json, reference the CARTO.js API available methods. For example, you can also use the returned layer to build more functionality (show/hide, click, hover, custom infowindows):
https://carto.com/docs/carto-engine/carto-js/getting-started/

Now the CARTO Builder does not have the option to share the viz.json URL due to the current version of CARTO.js (v3.15), is not compatible with the Builder. 
The new version of CARTO.js (v4) will be released by March/April 2017 and it will be compatible with the CARTO builder...


Best tutorial for cartoDB and odyssey.js
https://github.com/mapninja/CartoDB_Odyssey_Tutorial_for_Story_Maps

only with maps 

viz.json files are related with Maps (visualizations) but not with tables (datasets):
http://gis.stackexchange.com/questions/171283/get-a-viz-json-uri-from-a-table-name/171377

some codes:

An HTML template that takes a viz.json and displays the map, SQL, and CartoCSS in a neat embeddable iframe
https://github.com/CartoDB/labs-cdbfiddle
http://cartodb.github.io/labs-cdbfiddle/#https://team.cartodb.com/u/chriswhong/api/v2/viz/b047457a-8e2d-11e5-87da-0e5db1731f59/viz.json
"builder" with the old: "api/v2/viz/ "


Carto Builder<->Carto.js->viz.json URL -> odyssey


example
a page produced by odyssey.js:
a map produced with the old builder "carto.com/viz/":
its viz..JSON URL:
idem pour 
viz.json est la même structure cartoDB. L'information entrée pour les pop-up et hover... reste associée à la carte et son dataset. 
Un viz.json est un fichier qui contient toutes les structures (et pas les données comme un texte dans info-windows qui est dans une cellule du dataset) nécessaire à la reproduction de la visualisation créée dans cartoDB. 
viz.JSON and SQL:

---
cartodb.createLayer(self.map, vizjson)
n'intervient qu'une fois dans chacun des 3 templates:
  • sandbox/scroll.html 
  • sandbox/slides.html 
  • sandbox/torque.html 
 cartodb.createLayer(self.map, vizjson)
               .done(function(layer) {

odyssey.js

https://github.com/CartoDB/odyssey.js/blob/master/ARCHITECTURE.md

Odyssey is a simple FSM (https://en.wikipedia.org/wiki/Finite-state_machine)
- states
- outputs
- triggers
Each state has multiple outputs To change state a trigger should be raised When the state machine is doing a switch between states no trigger is taken into account Each state have internal states.


  • timeline
    • time in range [0, 1]
  • trigger
  • action
  • when a trigger moves the timeline other triggers don't take affect
  • trigger can be continous or fixed
    • actions can be:
    • undo/redo
    • once


cartoDB.js

cartodb.createVis(map_id, vizjson_url[, options] [, callback])
Creates a visualization inside the map_id DOM object.
cartodb.createVis(map_id, vizjson_url[, options] [, callback])
Creates a visualization inside the map_id DOM object.

cartodb.createLayer(map, layerSource [, options] [, callback])
With visualizations already created through the CARTO console, you can simply use the createLayer function to add them into your web pages. Unlike createVis, this method requires an already activated map object and it does not load a basemap for you.

https://github.com/CartoDB/cartodb.js/

createvis-vs-createlayer


https://carto.com/academy/courses/cartojs-ground-up/createvis-vs-createlayer/

In CARTO, there are two main methods to bring your maps into custom webpages, createVis and createLayer.

The first method, createVis allows for quick and easy maps with a large degree of customization. It gives two map layers in an array: layer 0 is the base map; layer 1 is the CARTO data layer.

The second method, createLayer, allows for much more customization, including the combining of layers from separate maps, each with its own levels of customization. createLayer also allows client-side control over basemaps.

Both methods allow custom CartoCSS styling, SQL queries, and overlay options (zoom controls, a search box, a share button, etc.). Before showing these methods, we need to be introduced to these methods’ main sources of information.

https://carto.com/academy/courses/cartojs-ground-up/createvis-vs-createlayer/#createvis
https://github.com/CartoDB/cartodb.js/blob/develop/doc/vizjson_format.md


faire un fichier CSV ou de transcodage pour l'interopérabilité en vue de faire une "narrative story map"; Choix de la baseMap (tiles) dans odyssey.

Je ne détaillerai pas les différents posts de ce blog sur les histoires narratives cartographiées
utiliser les tags "map" ou "GPS"...

J'ai réalisé un programme pour faire le fichier/données/documents/récits de base et de conversion.

1/ étape flickr

Je télécharge mes images géo-taggées de ma ballade dans Flickr et je met mon choix dans un album
ou s'il y a trop de photos-slides de faire deux albums...

2/ étape écriture

puis un fichier  pour le récit
"name, description"
(name et description n'ont pas de ",")

3/étape transcodage 

  • le transcoder pour le format odyssey.js (ci-dessous)
  • le transcoder pour Story Map Tour (ci-dessous)

pour odyssey.js

les "live examples":
http://cartodb.github.io/odyssey.js/documentation/#the-odyssey-sandbox

le format d'une web slide=
#Adding images to your story
```
- center: [40.7365, -73.9982]
- zoom: 13
L.marker([40.7348, -73.9970]).actions.addRemove(S.map)
```
By default, images are also supported. 
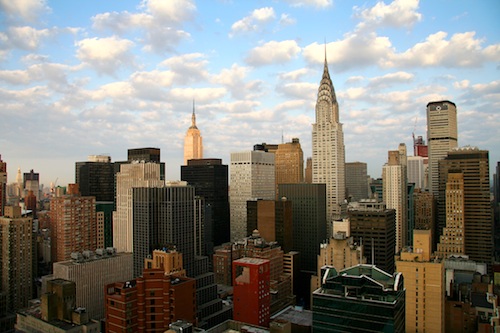
![New York](http://www.boston-discovery-guide.com/image-files/new-york-1.jpg "beautiful!")

Remarque: cette ligne de markdown produit ce code html:
<img src="URL.jpg" alt="New-York" title="beautiful!" />
Lorsque l'on passe la souris sur l'image le texte beautiful! apparait (c'est un hoover popup).
Donc pour chaque image il est préférable de prévoir 3 variable text.
De même pour un lien vers une URL.htm
[Markdown] (http://daringfireball.net/projects/markdown/] "title")
il n'y a pas de "!" pour une URL.htm.

NOTE: There is a known bug in Markdown.pl 1.0.1 which prevents single quotes from being used to delimit link titles.

De plus il est préférable avant la narration de préparer les cartes :
http://mapninja.github.io/CartoDB_Odyssey_Tutorial_for_Story_Maps/
  • Create an empty CartoDB table
  • Populate that table with fields for your data
  • Add the data to your new empty table
  • 'Geocode' your records so that they show up on the map
  • Customize the Pop-up and Hover doo-dads
  • Find your Map ID to put into Odyssey.js
  • Use the Odyssey.js 'Sandbox' to create a basic Story Map
  • Use an historic map from DavidRumsey.com as a basemap in your Story Map
  • Share your Odyssey.js Story Map with a URL, Embed Code, or host it yourself.
Hélas odyssey.js ne gère pas la carte de manière assez fine et repose sur deux 
points pour la carte
-baseurl
-vizjson
par exemple une "History of San Francisco" (que du "hover"):
pour, http://web.stanford.edu/~maples/maps/odyssey/odyssey.html

et pour un super tuto:
avec page "mapninja".github.io et son github: "github.com/mapninja"
https://github.com/mapninja/CartoDB_Odyssey_Tutorial_for_Story_Maps
et aussi son story map fait avec odyssey.js publié sur bl.ocks.org:
http://bl.ocks.org/anonymous/raw/409cb9de4c713e082dee/
il ya du hoover et aussi du popup.
tous ces événements sont dans le vizjson:
```
-baseurl: "http://georeferencer-0.tileserver.com//266b60e098fda1ddbe521ebff0e4d8676a549302/map/CGtnosESWB2NnsgVyjmQc5/201411301752-7AINSs/affine/{z}/{x}/{y}.png"
-title: "The Tattoo Map of San Francisco"
-author: "Stace Maples"
-vizjson: "https://stanfordgeo.cartodb.com/u/stacemaples/api/v2/viz/7840fa14-e940-11e4-bb41-0e49835281d6/viz.json"
```
Ils utilisent  un serveur de tuile pour les cartes anciennes:
http://www.davidrumsey.com/view/georeferencer

Pour renvoyer les informations "popup" suite à un événement click ou hover, c'est avec cartoDB.
Avec cartoDB, on peut choisir son format des data, par exemple:

Our blank table already has description and name fields, so we don't need to add those. We do want to add images to our pop-ups, as well as links our image sources and maybe even links to other websites with more information on the subject of the points we input. Let's add columns for those...
Add the following columns using the Add new column dialog box (just click the Add Column button again for each one):
  1. Description
  2. 'img_url1' with a type of 'string'
    (this will hold the URL for the image you want to show up in your pop-up)
  3. 'img_url1_src' with a type of 'string'
    (to hold the URL of the website you got the image from)
    If you want more than one image per pop-up, just add more sets of 'img_url#' and 'img_url#_src' columns, iterating the number (not too many, though, you'll be able to insert images into the narrative text of your Odyssey.js Story Map)
  4. 'link_url1' with a type of 'string'
    (This will hold a URL to link out to other sources of information)
  5. Again, if you want more links, just iterate the 'link_url#' column
  6. 'latitude' with a type of 'number'
  7. 'longitude' with a type of 'number'
Voir cet exemple avec google drive spreadsheets:

  • soit on exporte en .CSV (en le sauvegardant sur son ordi).
       puis on importe dans CartoDB. 
  • soit on importe directement ce fichier google drive (le nom du fichier est gardé; en fait il est importé en .CVS).
On obtient:


Attention cartoDB odyssey est  en (Lat, Long) par cette façon de rentrer les données 
(Rem: GeoJSON est en (Long,Lat)). 
Je vous conseille de mettre une colonne avec le titre The_geom et de mettre le string suivant avec ce format:
{"type":"Point","coordinates":[4.123694,45.142316]}
 avec en dernier la Longitude, ici 45.
Garder les deux colonnes séparées de chiffres avec les titres lo et la (pas Long ni Lat comme titre de colonne sinon cartoDB génère une erreur d'inversion) pour de futur interopérabilité de votre fichier excel.

Regarder votre data si tout va bien. Les titres doivent être en ASCII.
Il faut maintenant éditer une map (sur le bouton vert en bas à droite).
puis clicker sur le bouton (ici en vert):
puis choisir les effets pop-up (et legend) et aussi les styles des points


relier la Visualisation CartoDB avec Odyssey.js

La première des choses vise l'utilisation de l'option vizjson dans la configuration de votre Odyssey.js markdown. Ainsi vous avez besoin du JavaScript API URL de votre visualisation.

Il faut aller dans votre CartoDB page et votre visualisation pour un click sur le "Share button" (en bas).
Hélas avec la V3 de de cartoDB.js (et builder; cartoDB est en v3.15 en oct 2016) et odyssey.js (qui date de 2013-2014), nous n'avons plus l'export comme dans
http://mapninja.github.io/CartoDB_Odyssey_Tutorial_for_Story_Maps/
https://carto.com/blog/map-of-the-week-an-odyssey-js-story-by-loomstate/
(a post of jul 2014)
voir:
http://gis.stackexchange.com/questions/218606/is-there-a-way-to-get-a-viz-json-url-from-carto-builder

The CARTO Builder does not have the option to share the viz.josn URL due to the current version of CARTO.js (v3.15) is not compatible with the Builder. The new version of CARTO.js (v4) will be released by March/April and it will be compatible with the CARTO builder.

Changer de baseMap pour odyssey

On a de nombreux serveurs de baseMap:
http://wiki.openstreetmap.org/wiki/Tiles

On a 3 choix dans le sandbox d'odyssey: nokia est la moins mauvaise...
c'est l'ensemble des choix par défaut dans cartoDB editor:
  • https://cartocdn_a.global.ssl.fastly.net/base-light/{z}/{x}/{y}.png
    qui est vraiment très light!! mais "unlimited use permitted" et en lien avec OpenStreetMap.
  • une autre du provider Stamen: http://{s}.tile.stamen.com/watercolor/{z}/{x}/{y}.jpg
    essayez (chargement lent):
    http://tile.stamen.com/terrain/{z}/{x}/{y}.jpg
    http://maps.stamen.com/#terrain/12/37.7706/-122.3782
  • une autre du provider ex-nokia, maintenant HERE ("nokia day"):
    https://2.maps.nlp.nokia.com/maptile/2.1/maptile/newest/normal.day/{z}/{x}/{y}/256/png8?lg=eng&token=A7tBPacePg9Mj_zghvKt9Q&app_id=KuYppsdXZznpffJsKT24
    (vendu en 2015): https://wego.here.comhttps://fr.wikipedia.org/wiki/HERE_WeGo
    essayer le mode hybrid:
    "https://2.maps.nlp.nokia.com/maptile/2.1/maptile/newest/hybrid.day/{z}/{x}/{y}/256/png8?lg=eng&token=A7tBPacePg9Mj_zghvKt9Q&app_id=KuYppsdXZznpffJsKT24"
Rem:'http://{s}.somedomain.com/blabla/{z}/{x}/{y}.png'
{s} means one of the available subdomains (used sequentially to help with browser parallel requests per domain limitation; subdomain values are specified in options; a, b or c by default, can be omitted), {z} — zoom level, {x} and {y} — tile coordinates.
Ref: http://leafletjs.com/reference.html#popup

https://developer.here.com/rest-apis/documentation/enterprise-map-tile/
https://developer.here.com/rest-apis/documentation/enterprise-map-tile/topics/example-hybrid-map.html

vous pouvez aussi copier/coller celles-ci de cartoDB:
http://a.basemaps.cartocdn.com/light_all/{z}/{x}/{y}.png
http://a.basemaps.cartocdn.com/dark_all/{z}/{x}/{y}.png

le plus important est de bien choisir en fonction de ses besoins.
Personnellement je préfère openstreetmap car très complète:
http://{s}.tile.openstreetmap.org/{z}/{x}/{y}.png
et aussi une carte "france" :  http://{s}.tile.openstreetmap.fr/osmfr/{z}/{x}/{y}.png
http://wiki.openstreetmap.org/wiki/FR:Servers/tile.openstreetmap.fr
voir les choix:
http://leaflet-extras.github.io/leaflet-providers/preview/

Il faut comprendre qq différences avec "tileset":
A "tileset" typically includes enough tiles to form a very large image, if they were shown all at once, and also several zoom levels. Generally the idea is not to show them all at once, but to display a particular area of the map on a website. Normally this is done using a JavaScript map library to provide panning and zooming functionality, and request downloading of new tiles as necessary to show the user new areas of the map (a Slippy Map). (http://wiki.openstreetmap.org/wiki/Slippy_Map)
Faire sa baseMap personnalisée:

voir mon post:
http://stephane-mottin.blogspot.fr/2016/11/faire-un-fichier-csv-ou-de-transcodage.html


--------------


On peut aussi faire son propre tiling:
http://www.maptiler.org/google-maps-coordinates-tile-bounds-projection/

Il existe des outils de conversion entre le format X/Y/Z et TMS:
The difference between XYZ and TMS tiles and how to convert between them
https://gist.github.com/tmcw/4954720


https://en.wikipedia.org/wiki/Tiled_web_map

-----Rem:
On peut aussi changer l'apparence de la map avec les tests conditionnels du CSS via le zoom par exemple:
http://cartodb3.rssing.com/chan-32620984/all_p2.html
It is easy to change the content of your story map by using conditional zoom visualizations in the CartoDB CSS interface. Here is a snippet from the Berlin Map (https://carto.com/blog/berlin-wall-post/; https://gist.github.com/namessanti/e7432a85159fca12978e ; http://bl.ocks.org/namessanti/e7432a85159fca12978e )
we shared above:
line-opacity:1;[zoom=17]{polygon-fill:#F11810;polygon-opacity:0.4;}[zoom=15]{polygon-fill:grey;polygon-opacity:0.4;}[zoom=10]{polygon-fill:grey;line-color:#808080;}
This code changes the visualization at zoom level 17, 15, and 10 to represent the parameters identified below the [zoom = ] section.
When you bring your CartoDB map into Odyssey.js, those conditions remain on your map and make it easy to change the appearance of your map by simply moving the zoom and assigning a story panel. You can play around with all sorts of conditional CartoCSS parameters
https://github.com/mapbox/carto/blob/master/docs/latest.md

Si on veut plus, il faut un peu de code dans le config block.

Ref: http://mapninja.github.io/CartoDB_Odyssey_Tutorial_for_Story_Maps/

pour Story Map Tour (ESRI)

une web_slide= les colonnes suivantes avec un return à la fin:
name,description,icon_color,long,lat,pic_url,thumb_url,is_video
exemple:
Welcome to the reserve,
"The reserve is managed jointly. The Kendall Frost Mission Bay Reserve is part of the University of California Natural Reserve System (UC NRS) and is managed by the University of California San Diego (UCSD). The adjacent Northern Wildlife Reserve is managed by the City of San Diego. <i><a href=""http://nrs.ucsd.edu/kendall.html"" style=""color:yellow"" target=""_blank"">More Info</a></i>",
R,
-117.2296755,32.7920955,
http://downloads.esri.com/blogs/places/missionbaymarsh/marsh_intro_picture.jpg,
http://downloads.esri.com/blogs/places/missionbaymarsh/marsh_intro_picture_thumbnail.jpg,

avec au max 99 lignes.

le zoom (et centrage) sera à mettre slide par slide...

pour le javascript, on peut voir:

pour Story Map Knightlab

si on ne veut pas utiliser leur éditeur slide par slide, il faut plonger dans leur structure JSON.

La structure de la web_slide est:
{
    type: "overview",      // optional; if present must be set to "overview"
    location: {            // required for all slides except "overview" slide
        lat: decimal,      // latitude of point on map
        lon: decimal       // longitude of point on map
    },
    text: {                // optional if media present
        headline: string,
        text: string       // may contain HTML markup
    },
    media: {               // optional if text present
        url: string,       // url for featured media
        caption: string,   // optional; brief explanation of media content
        credit: string     // optional; creator of media content
    }
}
La structure de gestion de l'array de cet objet "slide" est:
{
    width: integer,                // required for embed tool; width of StoryMap
    height: integer,               // required for embed tool; width of StoryMap
    font_css: string,              // optional; font set
    calculate_zoom: true,              // optional; defaults to true.
    storymap: {
        language: string,          // required; two-letter ISO language code
        map_type: string,          // required
        map_as_image: false,       // required
        map_subdomains: string,    // optional
        slides: [object]           // required; array of slide objects (see below)
    }
}

Timeline Knightlab

Rem: l'utilisation de leur célèbre timeline est possible.
Elle se fait avec un fichier tableur
mais hélas les cartes sont à faire puis une URL dans une case du tableur...
Une carte par exemple une google map ou une cartoDB (avec l'excellent builder; voir ci-dessous), peut être mise sous forme de link_URL. 

le fichier tableur doit être stocké dans Google Drive, voir ici le template:

Year ,Month, Day, Time, End Year, End Month, End Day, End Time, Display Date, Headline, Text Media, Media Credit, Media Caption, Media Thumbnail, Type, Group, Background
soit 16 colonnes.
dans media ce sont des URL.
dans media caption: du texte ou par exemple <a href="http://www.flickr.com/photos/zachwise/6115056146/" title="Chicago by zach.wise, on Flickr">Chicago by zach.wise</a>


JackDougherty/leaflet-storymap or mapbox (2016)

Scroll-driven story map, with point markers and narrative text in GeoJSON, using Leaflet and jQuery.
https://github.com/jackdougherty/leaflet-storymap

  • Scroll-driven navigation, using screen swipe, trackpad, or keyboard down-arrow. Initial map displays all point markers.
  • Viewers can pan and zoom the map independently of the narration, or click on any point to go directly to that chapter.
  • Easy-to-learn template to create your own storymap. Upload text, point coordinates, zoom levels, and image links to a CSV generic spreadsheet, and drag into http://geojson.io to create a GeoJSON data file.
  • Images can be stored in local subfolder or pulled from an external URL.

Due to GeoJSON data limitations, there is no easy way to insert hyperlinks inside the 'description' text. They must be created outside, in fields such as "source-link".
Then there are no hover or popup events on the map...

The HTML code in the demo map is very well documented. if you have used Leaflet.js before then you should be easily able to use the template and even adapt it for your own use. The 'read me' file on  leaflet-storymap's GitHub page also contains a number of useful links to other story map templates.

with mapbox:
http://jackdougherty.github.io/mapbox-storymap/index.html

marker/pulse (animated) 3 choices of basemap:
http://jackdougherty.github.io/mapbox-storymap/pulse.html
no UI events on the map.

Examples with Added Features

Explore http://pembrokesoundscapes.ca/map, view code at https://github.com/rblades/rblades.github.io. Added audio playback in the narrative, historical map layers.
no UI events on the map.

Story Mapbox GL.js

A very quick way to create an effective scroll-driven story map is to use Mapbox GL. The advantage of using Mapbox GL over some other mapping libraries is that Mapbox GL allows you not only to zoom and pan the map but to rotate the map to provide different perspectives on your featured locations

If you want to create a Mapbox GL story map there is also the added advantage that Mapbox has provided a great template in their list of 'example' maps. The Fly to a location based on scroll position map in the Mapbox GL examples (https://www.mapbox.com/mapbox-gl-js/example/scroll-fly-to/) provides a neat demo of the possibilities of a Mapbox GL story map (all you have to do to create your own story map is copy & paste the provided code and change the content to suit the story you want to tell).
An example of story map (without UI events):
https://www.mapbox.com/mapbox.js/example/v1.0.0/scroll-driven-navigation/
An example: Slideshow gallery in a marker tooltip; Add a custom slideshow to a marker's tooltip.
https://www.mapbox.com/mapbox.js/example/v1.0.0/markers-with-image-slideshow/

This JavaScript library uses WebGL to render interactive maps from vector tiles and Mapbox styles. We found out how to to configure the color mapping on the client side and minimize data traffic while rendering a lot of data (https://www.ubilabs.net/en/news/data-driven-raster-layer-mapbox-lg-2016-09-05).

http://carlapedret.github.io/jewellerymap/
A beautiful example of a Mapbox GL story map is Birmingham Eastside's Gentrification in Birmingham’s Jewellery Quarter. Birmingham Eastside has used the Mapbox GL demo map to create a mapped guide to how gentrification is affecting Birmingham's Jewellery Quarter.
As you scroll through the map you are taken on a tour of the neighborhood, highlighting some of the biggest changes in the area. The Gentrification in Birmingham's Jewellery Quarter map also features map markers which provide another level of interactivity to the map. These markers provide additional information and media - such as audio recordings of interviews with some of the individuals featured in the side-panel content.
https://github.com/carlapedret
only copy/paste in html (in GitHub and after to github.io hosted pages http://carlapedret.github.io/jewellerymap/).

https://www.mapbox.com/bites/00110/
Mapbox have also used their own story map format to create a map of the intriguing case of Robert Durst. Durst was arrested on a first-degree murder warrant. If convicted he could face the death penalty.
Following the Life and Death of Robert Durst plots the key movements and actions of Robert Durst since his first wife 'disappeared' three decades ago up until his arrest in New Orleans. As well as the scroll-driven narration and up-dating map 'Following the Life and Death of Robert Durst' uses map markers and polylines to track Durst's movements around the country and to connect all the featured locations together.
-->no UI events on the map.


Ref: http://googlemapsmania.blogspot.fr/2016/08/mapbox-story-maps.html

Tools

---------------
Tools markdown/HTML
(Convert HTML to Markdown...)

Rem:
Remember that GeoJSON stores coordinates in "reversed order" (longitude, latitude)


mapbox studio, mapbox.js and story map: many examples and import/export and plug-in (leaflet).


Built on top of Leaflet: http://leafletjs.com/

many examples

basics

https://www.mapbox.com/mapbox-gl-js/example/popup-on-hover/
https://www.mapbox.com/mapbox-gl-js/example/custom-marker-icons/

scroll-driven story map 

A very quick way to create an effective scroll-driven story map is to use Mapbox GL. The advantage of using Mapbox GL over some other mapping libraries is that Mapbox GL allows you not only to zoom and pan the map but to rotate the map to provide different perspectives on your featured locations

If you want to create a Mapbox GL story map there is also the added advantage that Mapbox has provided a great template in their list of 'example' maps. The Fly to a location based on scroll position map in the Mapbox GL examples (https://www.mapbox.com/mapbox-gl-js/example/scroll-fly-to/) provides a neat demo of the possibilities of a Mapbox GL story map (all you have to do to create your own story map is copy & paste the provided code and change the content to suit the story you want to tell).
An example of story map (without UI events):
https://www.mapbox.com/mapbox.js/example/v1.0.0/scroll-driven-navigation/
An example: Slideshow gallery in a marker tooltip; Add a custom slideshow to a marker's tooltip.
https://www.mapbox.com/mapbox.js/example/v1.0.0/markers-with-image-slideshow/

This JavaScript library uses WebGL to render interactive maps from vector tiles and Mapbox styles. We found out how to to configure the color mapping on the client side and minimize data traffic while rendering a lot of data (https://www.ubilabs.net/en/news/data-driven-raster-layer-mapbox-lg-2016-09-05).

A very good example:

http://carlapedret.github.io/jewellerymap/
A beautiful example of a Mapbox GL story map is Birmingham Eastside's Gentrification in Birmingham’s Jewellery Quarter. Birmingham Eastside has used the Mapbox GL demo map to create a mapped guide to how gentrification is affecting Birmingham's Jewellery Quarter.
As you scroll through the map you are taken on a tour of the neighborhood, highlighting some of the biggest changes in the area. The Gentrification in Birmingham's Jewellery Quarter map also features map markers which provide another level of interactivity to the map. These markers provide additional information and media - such as audio recordings of interviews with some of the individuals featured in the side-panel content:
(iframe of soundclound like this:
<iframe width='100%' height='275' scrolling='no' frameborder='no' src='https://w.soundcloud.com/player/?url=https%3A//api.soundcloud.com/tracks/259889010&amp;auto_play=false&amp;hide_related=false&amp;show_comments=true&amp;show_user=true&amp;show_reposts=false&amp;visual=true'></iframe>",
(iframe XXXX below)
in this GeoJSON structure:
{
        "type": "Feature",
        "properties": {
            "title": "Matthew why",
            "description": "<div class='marker-title'>A central location and an historic flavour</div> \
            <p>Matthew Bott is from Birmingham and lives in the Jewellery Quarter since 2007. The privilege to walk to his work place and the special character of the area are his reason to live in the neighbourhood. (Image: Flickr/Roland Turner).</p> \
            <iframe XXXX </iframe>",
            "marker-symbol": "marker",
        },
        "geometry": {
            "type": "Point",
            "coordinates": [-1.907828, 52.486782]
        }
    },

https://github.com/carlapedret
only copy/paste the example's html of mapbox.js (put in GitHub and after to github.io hosted pages http://carlapedret.github.io/jewellerymap/).

other example 

https://www.mapbox.com/bites/00110/
Mapbox have also used their own story map format to create a map of the intriguing case of Robert Durst. Durst was arrested on a first-degree murder warrant. If convicted he could face the death penalty.
Following the Life and Death of Robert Durst plots the key movements and actions of Robert Durst since his first wife 'disappeared' three decades ago up until his arrest in New Orleans. As well as the scroll-driven narration and up-dating map 'Following the Life and Death of Robert Durst' uses map markers and polylines to track Durst's movements around the country and to connect all the featured locations together.
-->no UI events on the map.

Video embeds in tooltips
Embedding iframe videos in feature tooltips:
https://www.mapbox.com/mapbox.js/example/v1.0.0/video/

Timeline with scaled markers
Use d3 to brush through a timeline of scaled markers with popups:
https://www.mapbox.com/mapbox.js/example/v1.0.0/timeline-scaled-markers/

import/export: Leaflet-Omnivore plug-in

avec https://api.mapbox.com/mapbox.js/plugins/leaflet-omnivore/v0.2.0/leaflet-omnivore.min.js
Some examples:
CSV
https://www.mapbox.com/mapbox.js/example/v1.0.0/omnivore-csv-simplestyle/
KML
https://www.mapbox.com/mapbox.js/example/v1.0.0/omnivore-kml-tooltip/
https://www.mapbox.com/mapbox.js/example/v1.0.0/omnivore-kml/
GPX, or WKT
https://www.mapbox.com/mapbox.js/example/v1.0.0/omnivore-wkt/

many plug-ins:

https://www.mapbox.com/mapbox.js/plugins/

https://www.mapbox.com/mapbox.js/example/v1.0.0/leaflet-fullscreen/
Leaflet Fullscreen
Add a control to enable a map to be in full screen mode.
Adds a button to your map that enables it to fill the screen using the HTML5 Fullscreen API.

intro studio

In Mapbox Studio, the dataset editor and style editor work together to help you make powerful custom maps. The dataset editor allows you to manage and edit geospatial data, and the style editor allows you to create custom map styles to your exact specifications. This guide will focus on the dataset editor, covering the basics of how a dataset is uploaded to your Mapbox account and the options in the dataset editor interface.

csv

many problems occur.

https://www.mapbox.com/help/define-csv/
When uploading CSV files, keep the following in mind:

CSV files must be in UTF-8 encoding.
CSV files must contain coordinates (latitude and longitude) when uploading in Mapbox Studio or Mapbox Studio Classic.
Only Mapbox Editor will geocode addresses found in a CSV file.
CSV files are for point data only.

geoJSON

no problem...
example for two points:
{
  "type": "FeatureCollection",
  "features": [
    {
      "type": "Feature",
      "properties": {
        "hover": "Yssingeaux"
      },
      "geometry": {
        "type": "Point",
        "coordinates": [
          4.123724699020386,
          45.142269883456066
        ]
      }
    },
    {
      "type": "Feature",
      "properties": {
        "hover": "Eglise"
      },
      "geometry": {
        "type": "Point",
        "coordinates": [
          4.12424772977829,
          45.14296420392794
        ]
      }
    }
  ]
}


GeoJSON is a file format for map data served by Mapbox web services and APIs. As a subset of the JSON format, it can be parsed in modern software and native to the JavaScript language.

When you create features in the Mapbox Studio dataset editor, you are creating GeoJSON that you can use with other Mapbox tools and APIs. These datasets can be accessed as GeoJSON by downloading directly from the Mapbox Studio Datasets page or by using the Datasets API.

If you have GeoJSON data you wish to put on a map, you can upload GeoJSON to your Mapbox account using Mapbox Studio. You can add this either as a dataset for quick updates or geometry changes or as a tileset for styling in your custom map.

The Mapbox Studio dataset editor is a tool for editing datasets. A dataset is an editable collection of GeoJSON features. Datasets can be uploaded to Mapbox via Mapbox Studio or the Datasets API.

Datasets are different than tilesets. It’s possible to modify dataset feature geometries and properties in the Mapbox Studio dataset editor and export to a tileset for styling. However, datasets themselves cannot be styled. Tilesets can be styled, but cannot be edited.

Export a dataset to a tileset and a style

After you have finished editing your dataset, click Save to review the changes you have made and click Export to export your dataset as a vector tileset. A vector tileset is a collection of data broken up into a uniform grid of square tiles at up to 22 preset zoom levels. Your tilesets are stored on the Tilesets page in your Mapbox account.

See my post:
http://stephane-mottin.blogspot.fr/2016/11/faire-un-fichier-csv-ou-de-transcodage.html