Thursday, November 10, 2016

Synthèse pour faire un choix pour faire une narrative story map de tourisme pour une ballade avec un appareil photo avec GPS intégré.


J'ai publié de nombreux posts pour les différentes stratégies de faire une story map pour une ballade avec un appareil photo avec GPS intégré (cliquer sur le tag map).
Ici nous avons une synthèse de cette quête.

Ces web services sont du type "avec account" interne style ArcGIS, ou compte google, twitter...
Voir mon autre blob sur les online web services (en anglais):

A propos des trajets dans les bois, sentiers, voir ce post qui date de 2011 et donc qui a vieilli mais qui reste intéressant pour les stratégies concernant les ballades à pieds car il est assez exhaustif:

Ici je m'intéresse au choix interopérable pour la gestion des contenus web (text, images, médias 3D, illustration SVG, slide temporelle et surtout une partie du monde du "map" et de la géomatique au sens général) pour faire une story map narrative touristique.

Le but est aussi de répondre à la question : comment gérer de manière pérenne et interopérable puis publier (de manière différente et sur plusieurs plateformes) une ballade "touristique"  avec X photos prises avec un système intégrant un GPS (ou ayant des données EXIF avec géo-tags, géo-données dans les métadatas de ces photos/video/sons)?

Les 3 possibilités

un fichier markdown avec odyssey.js et son sandbox

Il faut faire un fichier avec le langage markdown .md (mais c'est facile avec le sandbox intégré; on peut toujours insérer du HTML). Plus tard si vous voulez utiliser ce fichier pour une autre application, vous pourrez le transformer en html facilement. Vous pourrez aussi le transformer en fichier excel avec quelques chercher/remplacer des balises et "tab" (ne pas utiliser "tab" dans ce fichier).

Il faut au préalable faire un upload de ses photos et récupérer les données GPS (Lat,Long) et les URL de chaque photos. Je vous conseille de faire un traitement par lot en ajoutant à la fin de nom de chaque fichier Lat,Long avec le format [45.3,4.4] par exemple avec graphic converter ou d'autres images organisateurs. Vous gagnerez du temps. Vous pouvez aussi choisir de manière séquentielle de faire une liste de déplacement de carte et de zoom puis de "ADD" dans le sandbox.

Vous pouvez aussi faire un extract des data GPS et les sauvegarder dans un fichier tableur ou text:
http://stephane-mottin.blogspot.fr/2016/11/takes-directory-full-of-images-export.html

A partir du même fichier markdown on peut faire 2 types de présentation, plus une autre avec le temps. 
Les limitations:
Le pointeur (toujours le même) ne supporte le clic pour afficher un pop-up par exemple.
En fait on ne peut que choisir "nokia day" pour la map (cartoDB light est trop simple) mais on peut activer cette option: 
If you are creating a visualization that uses a CartoDB map, you will see the following options in addition to the default:

  • cartodb_filter
    • The value for the column you want to filter
  • vizjson
If you wish to use a CartoDB data visualization in your story, you will use the “vizjson” option to link to the visualization. The vizjson URL that you need to include here can be found by going to your visualization in CartoDB, clicking “Share” in the upper right corner, and copying the CartoDB.js link. Then paste this link in the vizjson parameter of your Odyssey.js story’s config block. It should look like the example below.- cartodb_filter: "column='VALUE'"- vizjson: "http://{user}.cartodb.com/api/v2/viz/{your-viz-key-here}/viz.json"
mapbox (template de HTML en faire du copier/coller de ses données)
https://www.mapbox.com/studio/signup/?plan=starter
(besoin d'un token...) Il faut copier/coller ses données dans le template en HTML de ces nombreux exemples... https://www.mapbox.com/mapbox-gl-js/examples/
 Ref: http://googlemapsmania.blogspot.fr/2016/08/mapbox-story-maps.html

Leaflet.js. Jack's leaflet-storymap
Jack Dougherty's leaflet-storymap is a great template to use for creating scroll-driven story maps with Leaflet.js.
Jack's leaflet-storymap is an easy to use template for creating a scroll-driven story map in which all the narrative content is loaded from a GeoJSON data file. You can view a demo of the template in action here:
http://jackdougherty.github.io/leaflet-storymap/index.html
https://github.com/jackdougherty/leaflet-storymap
Easy-to-learn template to create your own storymap. Upload text, point coordinates, zoom levels, and image links to a CSV generic spreadsheet, and drag into http://geojson.io to create a GeoJSON data file.
Limitations: due to GeoJSON data limitations, there is no easy way to insert hyperlinks inside the 'description' text. They must be created outside, in fields such as "source-link"...

voir son livre en anglais: https://www.datavizforall.org/ (Tell your story and show it with data.)

Voir aussi:
http://muxlab.github.io/map-effects-100/Leaflet/11_scroll-driven-map-navigation.html
 https://github.com/muxlab/map-effects-100

The HTML code in the demo map is very well documented. if you have used Leaflet.js before then you should be easily able to use the template and even adapt it for your own use. The 'read me' file on  leaflet-storymap's GitHub page also contains a number of useful links to other story map templates.

Les éditeurs avec des boites insert "images" "texte" (philosophie "authoring tool" multiclick): 

Ce sont des "open source"mais pas de sandbox pour ces javascripts "storymap.js".
On a actuellement 3 sociétés:
  • https://storymap.knightlab.com/  avec différents choix de visualisation
  • https://story.mapme.com avec différents choix de visualisation
  • http://storymaps.arcgis.com/fr/
    Les chargements de vos story map sont très longs sauf pour ceux de la web application  "short list" mais qui est trop limitée à mon goût.
    On a de nombreux choix de Story Map Builders (Cascade, Crowdsource, Map Tour...):
    • Story Map Shortlist. Liste organisée de lieux d'intérêt. Présentez un grand nombre de lieux organisés par onglets thématiques, par exemple, restaurants, hôtels et attractions. Lorsque vos utilisateurs explorent la carte, les onglets s'actualisent afin d'afficher uniquement les lieux dans leur étendue de carte actuelle. les photos GPS-taggées ne sont pas reconnues et ils faut mettre à la main l'emplacement soit avec une adresse, nom ou soit avec des coordonnées.
      Essayez et comparez les pages web générées avec votre test (3 images) avec mapme et knightlab.
    • Story Map Cascade, ici les photos GPS-taggées téléchargées sont reconnues et mises au bon endroit sur la carte. Les images que vous chargez à partir du disque sont hébergées dans votre web application Cascade automatiquement. Si vous vous loggez avec votre compte google, les images seront dans le site XXX.googleusercontent.com/YYY.
      Il faut lire le tutoriel car c'est pas évident de gérer les nombreuses possibilités de positionnement des contenus et les cartes.
    • Story Map Crowdsource. L'application Story Map Crowdsource vous permet de publier et de gérer un récit collaboratif auquel tout le monde peut apporter des photos avec légendes. Utilisez-le pour faire participer un public précis ou général sur le sujet de votre choix. Pour contribuer à votre récit, les utilisateurs peuvent se connecter avec leur compte Facebook, Google ou ArcGIS, ou utiliser une option d'invité. Une fonction de vérification vous permet d'examiner et d'approuver les contributions.
      IL FAUT UN ABONNEMENT PAYANT A arcGIS (version d’évaluation gratuite de 60 jours )...
    • Autres (plus simple ou plus spécialisée): http://storymaps.arcgis.com/fr/app-list/
      • MapTour
        Présentez un ensemble de photos ou de vidéos avec légendes, associées à une carte interactive. Elle se prête parfaitement aux promenades ou aux séquences de lieux que les utilisateurs sont invités à suivre dans l'ordre.
        Enter your email address or your ex-Picasa/Photos/Google+ id. Your pictures must be shared publicly. The import will be limited to the first 99 pictures.
        Map Tour Builder http://www.arcgis.com/apps/MapTour/index.html?fromScratch
        ici les photos GPS-taggées téléchargées sont reconnues et mises au bon endroit sur la carte ( si vous avez activé dans Préférences géographiques "tout le monde" : https://www.flickr.com/account/geo/privacy/?donegeopriv=1&from=privacy)
        On peut aussi importer avec un fichier CSV. Voir le template:
        https://raw.github.com/Esri/map-tour-storytelling-template-js/master/samples/csv_file__lat_long/Locations.csv
        C'est séparé par des virgules:
        name,description,icon_color,long,lat,pic_url,thumb_url,is_video
        exemple:
        Jimson Weed,"This is a typical upland marsh plant.",R,-117.2323986,32.7898303,http://downloads.esri.com/blogs/places/missionbaymarsh/jimson_weed.jpg,http://downloads.esri.com/blogs/places/missionbaymarsh/jimson_weed_thumbnail.jpg,
        Rem: 
        Formatting your caption text using HTML tags The header and picture title/caption can include HTML tags to define formatting and links. For example, this code adds a yellow link: <a href="http://storymaps.esri.com/" style="color:yellow" target="_blank">StoryMaps Website</a>
      • Story Map Journal
        Créez une narration détaillée organisée en sections présentées dans un volet latéral déroulant. A mesure que les utilisateurs font défiler les sections dans votre Map Journal, ils voient le contenu associé à chaque section, tel qu'une carte, une scène 3D, une image, une vidéo, etc.
        http://www.arcgis.com/apps/MapJournal/index.html?fromScratch
      • Story Map Series
        1/Mise en page sous forme d'onglets-->  Présentez une série de cartes (donc assez différente, utile aussi pour présenter divers data/thème sur une carte) via un ensemble d'onglets. Un volet descriptif facultatif affiche du texte et d'autres contenus associés à chaque carte--> Mise en page en accordéon latéral
        2/Présentez une série de cartes, ainsi que le texte d'accompagnement et d'autres contenus pour chaque carte, dans un volet pouvant être développé. Le fait de cliquer sur un titre sélectionne la carte et développe le volet pour afficher le texte.
        3/Mise en page sous forme de puces-->  Présentez une série de cartes via des puces numérotées, une carte par puce. Il est conseillé de l'utiliser lorsque vous devez présenter un nombre important de cartes et d'emplacements. Un volet descriptif facultatif affiche du texte et d'autres contenus associés à chaque carte.
      • Story Map Swipe. Permettez à vos utilisateurs de comparer deux cartes Web distinctes ou deux couches d'une seule carte en déplaçant un outil de balayage en avant et en arrière.
      • Story Map Spyglass. Cette application est similaire à Swipe, mais la différence réside dans le fait qu'elle permet à vos utilisateurs de voir une carte à travers une autre grâce à l'outil de longue-vue.


Dans Story Map Cascade, on a un vaste choix de carte. On réalise un clic sur "edit":

qui ouvre cette fenêtre:

Le menu du haut est très riche.
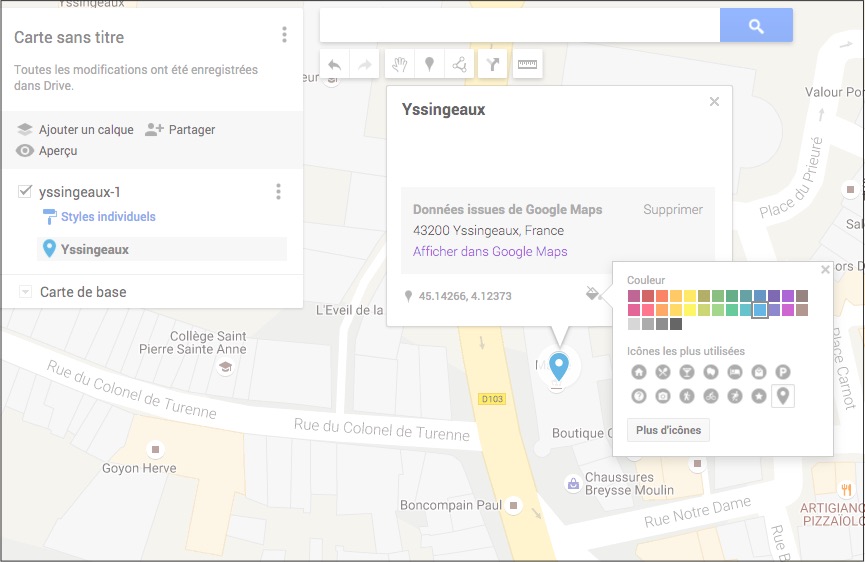
Aller dans "Details": beaucoup de possibilité pour modifier chacun de vos marqueurs par exemple;
et dans "fenêtre contextuelle" affichage d'une autre ou la même image, courbe, histogramme.


Je ne vais pas détailler les menus de "Contenu". Juste vous pouvez voir en bas  une "feuille tableur" qui contient tous les marqueurs de cette "layer",  hélas, en fait c'est une table "HTML". On peut copier le code mais il ne contient pas les données GPS Lat,Long!

Remarquez l'utilisation possible du fond de carte d'openstreetmap.

Pour l'utilisation avec google (post de sept 2016, Picasa and Google Photos: What story map authors need to know):
https://blogs.esri.com/esri/arcgis/2016/09/13/story-maps-and-picasa/
Yes, you can use Google Photos, but it currently requires a little extra effort. As of this blog post, there’s no way to make photos public in Google Photos, but you can do this in Picasa Google+.
Rem: Google+ Creative Kit is an online photo editor integrated to Google+ on October 27, 2011, which is essentially Picnik, integrated earlier to Picasa Web Albums (wikipedia).
In May 2015, Google+ launched “Collections” feature which was inspired by Pinterest. It allows users to "build content collections based on topics and interests".

On peut télécharger de nombreuses photos d'un seul coup qui apparaissent en diaporama dans son mur. On peut aussi les transférer dans une Google+ collection.
En faisant un "post" dans Google+, le téléchargement de photos avec des géo-tag Lat,Long permet de visualiser la position via "information". En cliquant sur la carte on obtient les coordonnées. Les autres données exif (modèle appareil photo et données optiques) apparaissent aussi (aussi pour les photos sans géo-data).
L'importation de photos dans Google+ inclut l'importation des informations stockées dans les images (métadonnées EXIF), notamment leur géolocalisation. Cliquez sur Détails de la photo en mode Lightbox pour afficher les informations relatives aux photos que vous avez importées.
https://support.google.com/photos?visit_id=1-636145364232375376-3774937042&rd=1#topic=6128818
Si il y avait plus d'option, on pourrait utiliser ce service pour faire une story map...
Dans "settings" Photos and Videos Shared on Google+, activez
"Show geo location by default on newly shared Google+ albums".

Voir les "open sources":
https://github.com/Esri
https://github.com/Esri/storymap-crowdsource
First create your Crowdsource story in ArcGIS Online using the step-by-step tutorial. Once your story is ready, you have to find its ID in ArcGIS Online. The ID is a 32 character string that you will find in your web browser's address bar when you are viewing your series (just after appid=).
Download the application
Deploy the application on your webserver.
Edit index.html, find the configuration section on line 24 and paste in your application ID
Navigate to index.html (e.g., https://www.example.org/StoryMapCrowdsource/index.html)

https://github.com/Esri/storymap-cascade
https://github.com/Esri/shortlist-storytelling-template-js
https://github.com/Esri/map-series-storytelling-template-js
View it live:
tab layout
accordion layout http://www.arcgis.com/apps/MapSeries/index.html?appid=ef703d9454bb4e4e8a9c1b086b5b66b5 (sur le gaz de schiste)
bullet layout
https://github.com/Esri/swipe-map-storytelling-template-js
The Story Map Swipe and Spyglass app enables users to interact with two web maps or two layers of a single web map.
https://github.com/Esri/map-tour-storytelling-template-js
https://github.com/Esri/text-and-legend-map-storytelling-template-js (old, now https://github.com/Esri/map-series-storytelling-template-js)
https://github.com/Esri/countdown-storytelling-template-js (old)
http://storymaps.esri.com/templates/countdown/ (The World's 25 Busiest Airports)

https://github.com/Esri/esri-leaflet
https://github.com/Esri/map-and-app-gallery-template
https://github.com/Esri/geotour-js
(interêt de faire une route avec des points d'arrêt
All it requires is a feature service with integer Sequence and string Name fields where records are to be visited in ascending Sequence order.)
https://github.com/Esri/arcgis-osm-editor
https://github.com/Esri/edit-template
Edit is a configurable application template that enables you to provide basic editing capabilites for editable layers in a web map. exemple intéressant (signaler une dégradation: http://www.arcgis.com/apps/Edit/index.html?webmap=25977874c66c4c0a8dcc181506c6fb45
C'est la même fenêtre des menus contextuels pour le marqueur cliqué que pour Cascade.
http://www.arcgis.com/home/item.html?id=2a9fbd75eea14c87a32d3799e00663f2
http://www.arcgis.com/home/search.html?t=content&q=tags:ArcGIS%20web%20application%20template

https://github.com/Esri/geoform-template-js
GeoForm is a configurable template for form based data editing of a Feature Service. This application allows users to enter data through a form instead of a map’s pop-up while leveraging the power of the Web Map and editable Feature Services.

https://github.com/Esri/geojson-layer-js
An easy way to load GeoJSON data into your ArcGIS map
  • Load GeoJSON from a file
  • Load GeoJSON from a server
  • Load GeoJSON data from a FeatureCollection
An easy way to load GeoJSON resources into your ArcGIS map. This is a simple custom layer that uses Terraformer (http://terraformer.io/) to convert GeoJSON to ArcGIS JSON. It "should" support all GraphicLayer operations. e.g. popups, rendering...

https://github.com/Esri/geojson-utils
converting between Esri's Geoservices JSON and GeoJSON
https://github.com/Esri/arcgis-to-geojson-utils
https://github.com/Esri/kml-for-geoevent (pour serveur).

Les éditeurs avec un fichier tableur "base de données"

Ici la base de données est un Google spreadsheet:
le texte accepte du HTML.

C'est la philosophie du:
les feuilles de calcul Google gèrent la gestion de contenu, de sorte que les modifications apportées à vos histoires sont faciles à réaliser sans toucher une ligne de code.
(Google spreadsheets handle content management, so changes to your stories are easy to make without touching a line of code). 
On a la même approche avec par exemple (a very simple content management system):
pour la création de site web.

Il faut au préalable faire un upload de ses photos et récupérer les données GPS (Lat,Long) et les URL de chaque photos. Je vous conseille de faire un traitement par lot en ajoutant à la fin de nom de chaque fichier Lat,Long avec le format [40.7348, -73.9970] par exemple avec graphic converter ou d'autres images organisateurs. Vous gagnerez du temps. 

Vous pouvez aussi faire un extract des data GPS et les sauvegarder dans un fichier tableur ou text:
http://stephane-mottin.blogspot.fr/2016/11/takes-directory-full-of-images-export.html

Les outils javascript "open source" de la knightlab 

Des outils de knightlab comme:
on peut comparer deux images par exemple des jpeg de carte pour voir l'évolution par exemple d'une déforestation.
JuxtaposeJS is a simple, open source tool for creating before/after image sliders. Just provide two image URLs and Juxtapose will do the rest of the work for you.

pour insérer du son dans sa "story".

outils pour analyser les réseaux sociaux.

un bookmarklet javascript pour copier image sur le web et mettre du texte.

Les feuilles de calcul Google gèrent la gestion de contenu, de sorte que les modifications apportées à vos histoires sont faciles à réaliser sans toucher une ligne de code.
(Google spreadsheets handle content management, so changes to your stories are easy to make without touching a line of code). 
On a la même approche avec par exemple (a very simple content management system):
pour la création de site web.
(.dmg pour mac).

template 
The basic setup is for authoring presentations only. The full setup gives you access to all reveal.js features and plugins such as speaker notes as well as the development tasks needed to make changes to the source.

takes a directory full of images, export Lat, Long data and makes a file (i.e. GeoJSON/HTML or spreadsheet or .kml) with all of the found GPS points. 2016 standard specification of the GeoJSON format: RFC 7946


directory full of images---> GeoJson or spreadsheet file (or kml)

-->GeoJson

GeoJSON is a format for encoding a variety of geographic data structures for example:
{
  "type": "Feature",
  "geometry": {
    "type": "Point",
    "coordinates": [125.6, 10.1]
  },
  "properties": {
    "name": "Dinagat Islands"
  }
}

GeoJSON supports the following geometry types: Point, LineString, Polygon, MultiPoint, MultiLineString, and MultiPolygon. Geometric objects with additional properties are Feature objects. Sets of features are contained by FeatureCollection objects.

In 2015, the Internet Engineering Task Force (IETF), in conjunction with the original specification authors, formed a GeoJSON WG to standardize GeoJSON. RFC 7946 was published in August 2016 and is the new standard specification of the GeoJSON format, replacing the 2008 GeoJSON specification.

Remember that GeoJSON stores coordinates in "reversed order" (longitude, latitude)

Some javascript codes:

1/exif-to-geojson
https://github.com/hallahan/exif-to-geojson
This javascript takes a directory full of images and makes a GeoJSON file with all of the found GPS points. Put the images you want to create a corresponding GeoJSON file with in the img directory.
node exif-to-geojson.js . The output will be written to exif.geojson
Demo: http://hallahan.github.io/exif-to-geojson

After you run the script, you can see the geojson with pop-ups that link to the corresponding images in index.html.
See also: https://github.com/hallahan/LeafletPlayback
This is a Leaflet plug-in that plays back points that have a time stamp synchronized to a clock. http://leafletplayback.theoutpost.io

2/exif-gps-to-json-example (quite complex)
https://github.com/omichelsen/exif-gps-to-json-example
Example code on how to save EXIF data from photos to a JSON file. http://ole.michelsen.dk/blog/showing-photo-gps-location-on-google-maps-with-gulp.html

This is the example code for the article Showing photo GPS location on Google Maps with gulp.
In this tutorial I will go through how to read the EXIF data from a folder of photots, and show the GPS location where each photo was taken in Google Maps. This article is based on the code I wrote to make my personal World Travel Map,
https://ole.michelsen.dk/photos/travel-map.html
(see this interesting "story map" with text!!!)
which shows where I've been based on my vacation shots.
https://ole.michelsen.dk/blog/showing-photo-gps-location-on-google-maps-with-gulp.html

We'll use the gulp build system to read the image files and output the data we need to a JSON file, which we can then read into Google Maps.

First we install gulp and a couple of packages, gulp-data, gulp-exif and gulp-extend:
npm install --save-dev gulp gulp-data gulp-exif gulp-extend
This will allow us to read the EXIF data from the image files, extract the part we need (GPS coordinates), and save it all into a single JSON file.

https://github.com/gulpjs/gulp/blob/master/docs/getting-started.md

Now we create a task called "exif", which does three things:

  • Reads the EXIF data from the images in the photos folder
  • Plucks out the GPS data and puts it in a JSON format with the filename as the key
  • Joins the JSON data into a single gps.json file

3/exif-geo
https://github.com/annejan/exif-geo
Show distance between image EXIF GPS data and Location API.

  • Use client side parser
  • Store results for statistical analysis
  • Auto positioning and scaling of map
Try it out at http://geo.printf.nl/

Some tools:
Convert GPS degrees, minutes, seconds coordinates to decimal value. Useful for parsing GPS exif tags in geotagged images, Google Maps, and Open Street Map (SOM).

https://github.com/Turistforeningen/dms2dec.js

Remember that GeoJSON stores coordinates in reversed order (longitude, latitude) which means you have to reverse the order of the coordinates returned from dms2dec():
var geojson = {
  type: 'Point',
  coordinates: dms2dec(lat, latRef, lon, lonRef).reverse()
};

4/GPSeitor (code date: 2014)
https://github.com/eltuza/GPSeitor
A Python application that processes a pictures directory and generates a static web page positioning the images that have GPS Exif data in a Google Map in a gallery-like fashion.

5/gps detect (firefox add-on)
https://github.com/allanlw/gps-detect
Firefox addon for detecting GPS EXIF info in JPEGs automatically.
GPSDetect is a simple Firefox addon that monitors Firefox network traffic and automatically alerts the user whenever a JPEG file loads that contains embedded EXIF GPS coordinates.
When an image is detected that contains GPS data, the user is alerted, and given a link to the offending image as well as the GPS information and a link to the location on a map.

Note that most major social networking sites strip EXIF information (including GPS locations). This includes Facebook, Twitter and imgur.

GPSDetect uses the Firefox Add-on SDK, which is required to build and install it, for now. To build a copy of GPSDetect, see the Add-on SDK installation instructions to activate the SDK's virtualenv, and then simply run cfx xpi in the GPSDetect root directory. You will get an unsigned XPI that can be installed into Firefox as usual.
https://developer.mozilla.org/en-US/Add-ons/SDK
https://developer.mozilla.org/en-US/Add-ons/SDK/Tools/jpm#Installation

6/jpeg-exif-data
https://github.com/BelfordZ/jpeg-exif-data
command line interface (cli) tool for pulling exif gps data from images

7/photo-saver
https://github.com/montanaflynn/photo-saver
Organize your photos based on exif date and GPS coordinates.
Usage:
This simple tool takes two arguments, an input directory and an output directory. The input directory should be a folder with photos that have exif data. The output directory is where you want the organized files to end up. Of course your original files are left alone.

Rem:
MongoDB is a free and open-source cross-platform document-oriented database program. Classified as a NoSQL database program, MongoDB uses JSON-like documents with schemas. MongoDB is developed by MongoDB Inc. and is free and open-source:
https://www.mongodb.com/
https://en.wikipedia.org/wiki/MongoDB

http://anonfunction.com/2014/10/exporting-mongodb-to-csv/

-->Spreadsheet file

The goal for this post is to extract Longitude and Latitude data from a folder of images and export the data in a CSV so it can be easily imported into a Fusion Table or other spreadsheet.

1/ use exifTool:

2/Once the installation is finished, open up Terminal or open up your Command Line on Windows or the stand-alone Windows executable.

Here is the line that you need to enter:

“exiftool -csv -filename -imagesize -gps:GPSLatitude -gps:GPSLongitude ./ > long.csv”

This command will go to the folder that you input and read through all of the images and pull out the filename, the image size, the GPS Latitude and the GPS Longitude and export everything to a CSV.

Here is the finished CSV that is opened in Excel:


mapme.com des outils pour "narrative story map"=trop limité par l'editeur (pas d'import)

examples:
https://story.mapme.com/westeros/e81c2d9a-95b3-4cd7-a511-abbd7dcf0ba6
https://story.mapme.com/2052dd91-a9e5-4d69-a7e7-4183d9645bce/c3bd9cc1-a803-496e-b510-cac379fbb64e

free-->existe ads et pas de customisation:
https://mapme.com/solutions/pricing/

Ne gère pas les données exif GPS de l'image téléchargée!!!
L'éditeur est trop limité en free.
ressemble aux outils https://storymap.knightlab.com/
avec la même stratégie "éditeur" en ligne :


https://story.mapme.com/43843665-e0a8-4606-8b28-53a503c24ef0

PS:
mapme classic:
https://mapme.com/support/knowledgebase/mapme-stories-vs-mapme-classic/

Wednesday, November 9, 2016

photo gps extract with some functions: Batch Extractor of many photos , save in spreadsheet, mapping with custom markers and right-clicked markers.


See also for extract AND SAVE (GeoJSOn or spreadsheet file):
http://stephane-mottin.blogspot.fr/2016/11/takes-directory-full-of-images-export.html

Exif and Geo-data

More and more modern digital cameras and smarphones have a built-in GPS module.
They record the latitude, longitude and elevation at the time a photo is taken (and other data in EXIF (Exchangeable image file format): https://en.wikipedia.org/wiki/Exif).

There are Meta information in a wide variety of files. There are different metadata formats including
  • EXIF, GPS, IPTC, XMP, JFIF, GeoTIFF, ICC Profile, Photoshop IRB, FlashPix, AFCP, ID3, 
  • as well as the maker notes of many digital cameras by Canon, Casio, DJI, FLIR, FujiFilm, GE, HP, JVC/Victor, Kodak, Leaf, Minolta/Konica-Minolta, Motorola, Nikon, Nintendo, Olympus/Epson, Panasonic/Leica, Pentax/Asahi, Phase One, Reconyx, Ricoh, Samsung, Sanyo, Sigma/Foveon, Sony...
Different methods of geotaging: 
the best = Automatic geotagging using a built-in GPS:

In regards to Point of interest (POI), many different file formats, including proprietary formats, are used to store point of interest data, even where the same underlying WGS84 system is used.
Some useful links which could be a basis of a metadata POI

In french:
the map:


Comparison of metadata editors:


apple desktop

apple photos and
the excellent graphic converter (shareware):
Graphic converter (v10) permet de sélectionner des dossiers, n photos...
et de sauvegarder un fichier .kml avec aperçus pour la sélection.

windows desktop

freeware pge

http://pge.bvsoft.be/pge6.php
PGE uses the Google Maps to show the coordinates of a photo. This means the application requires an active Internet connection: you can't use PGE offline.

There are several possibilities to locate a photo in Photo GPS Extract:
  • Launch the program and open a photo through the menu File - Load Photo.
  • Drag a JPG from your desktop or Windows Explorer, then drop it over PGE's main screen.
  • Right-Click any JPG photo in Windows Explorer. Then click the "Send To" menu and select "Photo GPS Extract". PGE will now be opened and display the location of the photo.
  • Right-click a JPG photo in Windows Explorer and select "Show GPS Location On A Map". (Please note you need to activate the option 'shell integration' before you can use this feature).
The Batch GPS Extractor is a tool to extract the coordinates from all pictures in a certain folder on your computer. This data can then be exported to a CSV file (Comma Separated Values) or a Google Earth .KML file. The Google Earth KML file generator offers a lot of options to customize your file.

Embedded map generator: Photo GPS Extract can generate the HTML code for your own embedded Google Map. This map can then be integrated in your website or BLOG (see the dialog was used to create the Google Maps).
Rem: "I deliberately decided NOT to build a geotagging feature. The design philosophy of Photo GPS Extract has always been the same: the software does NOT alter your photos in any ways."
For geotagging,  go to http://pge.bvsoft.be/geotagging.php

Multi-platform

open source

ExifTools
Read, Write and Edit Meta Information
ExifTool is a platform-independent Perl library plus a command-line application for reading, writing and editing meta information in a wide variety of files. ExifTool supports many different metadata formats including EXIF, GPS, IPTC, XMP, JFIF, GeoTIFF, ICC Profile, Photoshop IRB, FlashPix, AFCP and ID3, as well as the maker notes of many digital cameras (by Canon, Casio, DJI, FLIR, FujiFilm, GE, HP, JVC/Victor, Kodak, Leaf, Minolta/Konica-Minolta, Motorola, Nikon, Nintendo, Olympus/Epson, Panasonic/Leica, Pentax/Asahi, Phase One, Reconyx, Ricoh, Samsung, Sanyo, Sigma/Foveon and Sony).

ExifTool is also available as a stand-alone Windows executable and a Macintosh OS X package: (Note that these versions contain the executable only, and do not include the HTML documentation or other files of the full distribution above).


on line service

une introduction à google local guide et "my map" (qui sont multilingues) et aussi Fusion Tables (et un peu "my time line" ). Ce sont des nièmes extensions à google map.


Connecter vous avec votre gmail puis:
https://maps.google.com/localguides/home?hl=fr

Explorez et rédigez des avis sur vos adresses avec Google Maps. Plus vous rédigez d'avis, plus vous bénéficiez d'avantages. Local Guides apparaît maintenant dans l'application Google Maps sur votre smartphone ou tablette Android et iOS..

clic en haut à droite. ce menu apparait:

Aller dans paramètres et choisissez votre ville de départ.

On a la page suivante au début:

On commence à 0 points.
Un clic sur ce bouton orange rédiger un avis. Ignorer.
Je vous conseille de mettre des images.

On est dirigé vers google map.
Il y a des choses nouvelles dans le menu à droite en haut. Je vous laisse découvrir car c'est assez riche. Vous pouvez y choisir votre langue (ici j'ai choisi en anglais).


Avec "photos" on obtient cette fenêtre:

Ici on a seulement l'aide...

Si vous faites partie du programme Local Guides, vous pouvez gagner des points en important des photos dans Google Maps.

Ajouter une photo

Déplacer la carte et un clic sur France par exemple.
Vous ouvrez Google Maps et "recherchez un lieu" apparait.
Après avoir sélectionné un lieu, cliquez sur Ajouter une photo. Vous devrez éventuellement faire défiler la page vers le bas pour afficher cette option.
Il faut impérativement faire un clic sur un marqueur POI (ici en rouge).
et "ajouter une photo" apparait à droite.  ouf!!!!!!! ;(

Remarque: Vous ne pouvez ajouter des photos que pour des points d'intérêt (tels que des établissements ou des parcs). Vous ne pouvez pas utiliser cette fonctionnalité pour des adresses ni des coordonnées.
Voir ci-dessous avec "my map" on peut se créer un marqueur où on veut et publier une photo mais hélas son géo-tag n'est toujours pas pris en compte.

Une fenêtre s'affiche alors. Faites glisser la photo que vous souhaitez importer ou cliquez sur Sélectionner les photos à importer.


J'ai essayé avec une photo qui est géotaggée avec un appareil photo ayant un GPS intégré et dont l'EXIF est OK.
Il n'a pas intégré cette information!!!!!

Cette photo est dans "xx.googleusercontent.com".
Elle apparait dans drive/photos/2016/xyz.jpeg

Avec http://photomap.booogle.net/, j'ai vérifié : cette photo a bien gardé son emplacement GPS.

Si vous l'effacer de votre drive. Elle reste dans la map!
pour l'effacer, il faut faire un clic en haut à droite de la photo pour voir ce menu:


Dans l'aide, "les photos contiennent parfois des informations sur le lieu où elles ont été prises. Si un lieu est associé à une photo, Google Maps peut vous inviter à ajouter la photo à ce lieu."
Ne fonctionne pas!

Les données de localisation proviennent de deux principales sources :

  • Le GPS de votre appareil photo peut enregistrer des informations de localisation. Si vous ne voulez plus enregistrer ces informations, consultez les instructions d'utilisation de votre appareil photo ou de votre application.
  • Google Photos peut ajouter une localisation à partir de l'historique des positions Google, qui est enregistré dans votre compte Google.---> Je déconseille cette méthode.
Dans local guide. aller dans le menu puis contribution puis carte, on obtient (si on a déjà une "my map":

Faire votre map "my map"

Pour commencer à créer une carte, vous pouvez le faire de x façons :

  • Depuis internet en spécifiant « Google My Maps » depuis la barre de recherche.
  • Depuis votre espace Google Drive Nouveau > Plus > Google My maps.
  • aller dans ce menu qui offre bcp de possibilités:


choisir vos adresses.


puis cartes , c'est "my map" (vous voyez c'est assez riche comme menu).


Vous avez un choix énorme de marqueurs:


et avec icône personnalisée, vous pouvez choisir une photo, une illustration.


Une fois que vous avez créé une carte dans My Maps, vous pouvez lui ajouter des informations et les modifier.
https://support.google.com/mymaps/answer/3433053?hl=fr

Types de contenu que vous pouvez ajouter

  • Photos et vidéos
  • Informations supplémentaires (description, prix, site Web, etc.)
  • Annotations textuelles au sujet d'adresses sur la carte

Ajouter et gérer des contenus

  • Ouvrez une carte existante dans My Maps sur votre ordinateur.
  • Cliquez sur un repère, une forme ou une ligne sur la carte. Dans le champ qui apparaît sur la carte, cliquez sur Modifier edit.
  • Pour ajouter du texte, saisissez-le dans le champ.
  • Pour ajouter des images ou des vidéos, cliquez sur l'icône représentant un appareil photo .
  • Choisissez comment vous souhaitez procéder. Pour ajouter d'autres photos ou vidéos, cliquez sur le bouton +. Pour supprimer une photo ou une vidéo, cliquez sur "Supprimer".

Cliquez sur Enregistrer.
Les modifications apparaîtront également dans le tableau.


On insère donc un marqueur:


Un clic sur l'icône et on télécharge et insère une photo à un endroit que l'on choisit!!!!
On voit le code GPS en bas à gauche de ce marqueur.

Rem:
Avec cette méthode on a bien gagné un point par image publiée...

A la fin on peut choisir un kml ou une iframe ou un lien de type:
https://drive.google.com/open?id=1F0EQOnoxO-pvc6LpcgTfmjhGR5c&usp=sharing

Attention ce n'est pas un lien map.google.com.

Aller plus loin

Ajouter des photos et d’autres contenus à votre carte
Suite à la création d’une carte dans My Maps, vous pouvez ajouter différentes informations et les modifier, soit :
  • Photos et vidéos
  • Informations supplémentaires (description, prix, site web, etc.)
  • Annotations textuelles sur les adresses de la carte.
Pour ajouter, gérer et modifier du contenu, il vous suffit de cliquer sur un repère marqueur, puis sur le bouton modifier et de renseigner ensuite les informations dans la nouvelle fenêtre.

Mais le + important est de pouvoir Importer des informations dans votre carte Google My Maps.

Ce web service permet également d’importer des données depuis des fichiers spécifiques:
Vous pouvez ainsi importer des fichiers au format csv, tsv, kml, kmz, gpx, xlsx, ou encore depuis une feuille Google Sheets.
vous ne pouvez pas importer un fichier contenant des données supérieures à 2000 lignes.

Pour importer des données, procédez comme suit :

1. Cliquez sur le bouton Importer présent lors de la création d’un nouveau claque.
2. Sélectionner alors le fichier à importer.
3. Choisissez une ou plusieurs colonnes de la carte.
4. Puis cliquez sur terminer.
Les adresses seront alors directement ajoutées à la carte et répertoriées dans la légende située sur la gauche.

Effectuer une recherche pour ajouter un lieu
Vous pouvez non seulement placer des repères, mais aussi rechercher un lieu spécifique (restaurant, hôtel, musée, etc.) en vue de l'ajouter à votre carte.
Dans le panneau de gauche, cliquez sur le calque que vous souhaitez utiliser. Le calque sélectionné est celui dont le bord gauche est affiché en bleu.
Recherchez le commerce, l'entreprise, l'adresse ou le point d'intérêt que vous voulez ajouter. Un nouveau calque provisoire portant le nom "Recherche : votre terme de recherche" apparaît automatiquement dans le panneau de gauche. Vos résultats s'affichent sur la carte sous forme de repères verts.
Pour ajouter ce repère à vos calques, cliquez sur le résultat. Cliquez ensuite sur Ajouter à la carte.
Dans le panneau de gauche, cliquez sur le bouton X au-dessus des résultats de recherche pour les effacer. Vous pouvez ajouter jusqu'à 2 000 éléments géographiques par calque.
Ref: https://support.google.com/mymaps/answer/3024925?p=lite_addplaces&rd=1

Découvrir comment ajouter plusieurs repères simultanément en important des données
Étape 1 : Préparez vos données
Vous pouvez importer un fichier CSV, TSV, KML, KMZ, GPX ou XLSX, ou une feuille de calcul à partir de Google Drive.
Remarque : Vous ne pouvez importer qu'un seul fichier de données (contenant jusqu'à 2 000 lignes) par calque.

Étape 2 : Importez vos contenus
Accédez à My Maps sur votre ordinateur.
Ouvrez une nouvelle carte ou une carte existante.
Dans la légende qui s'affiche sur la gauche, cliquez sur le calque auquel vous souhaitez ajouter des données.
Cliquez sur Importer. Vous pouvez importer des fichiers CSV, TSV, KML, KMZ, GPX ou XLSX, ou des feuilles de calcul provenant de Google Drive.
Faites glisser un fichier présent sur votre ordinateur, sélectionnez un fichier Google Drive ou ouvrez une carte My Maps existante.
Cliquez sur Sélectionner un fichier à importer.
Choisissez une ou plusieurs colonnes contenant les informations de géolocalisation des données.
Cliquez sur Continuer.
(Je conseille d 'utiliser les données au formar "Lat,Long" de google maps qui apparaissent dans les marqueurs réalisés à la main, ou de faire un GPS extract de son lot de photos)
Sélectionnez la colonne à utiliser pour appliquer un libellé aux données de la carte.
Cliquez sur Terminer.
Il faut mettre dans la troisième colonne, par exemple "intérêt"...
Les lieux sont automatiquement ajoutés à la carte et répertoriés sous forme de liste dans la légende à gauche.
Voici un exemple de tableau:

et le résultat avec un clic sur le marqueur:

Après il faut mettre les photos/videos à la main en un clic sur chaque marqueur...
Ref: https://support.google.com/mymaps/answer/3024836

Vous pouvez aller voir un autre tableau plus complet que ce template:
https://docs.google.com/spreadsheets/u/1/d/1xuY4upIooEeszZ_lCmeNx24eSFWe0rHe9ZdqH2xqVNk/pubhtml

« Timeline »

Vous souhaitez tester des outils google de localisation. Alors je vous conseille de jeter un coup d’œil à « votre Timeline »:
https://www.google.fr/maps/timeline

Explorez vos trajets
Cette application assez méconnue de Google Maps permet de savoir exactement où vous étiez et montrer les moindres de vos déplacements. Que vous ayez commencé votre soirée dans un restaurant, un cinéma, pour finalement finir le lendemain matin à votre domicile, Google Maps pourra désormais retracer les lieux visités. mais bof...

https://support.google.com/maps/answer/6258979?co=GENIE.Platform%3DDesktop&hl=fr

https://productforums.google.com/forum/#!topic/maps/AVeXPcS8ni8

Ref: http://www.windtopik.fr/creer-des-cartes-personnalisees-avec-google-my-maps/


Fusion tables (in english)

Fusion tables are more difficult to use than My Maps, but you do have more control over the look of the map, and it will remain linked to the table for future updates.

For this tutorial, a sample dataset is provided containing records of insects collected in Costa Rica by ecologists. Each location is recorded with a latitude and longitude point:
Ref: https://support.google.com/fusiontables/answer/2527132?hl=en

Import the data

Download this sample insect dataset.
Go to Google Drive. Sign in to your Google Account or create a Google Account if you don't already have one.
Click the "Create" button.
Click the "Connect more apps" bar at the bottom of the resulting list.
Type "fusion tables" in the "Search Apps" box and hit the "Enter" key.
Click the blue "+ CONNECT" button, then click the "OK" button in the confirmation dialog box.
Click "Create > Fusion Table (experimental)".
In the Import new table dialog box, click "Choose File".
Select the "Astraptes fulgerator complex sample data.csv" file you downloaded, and click "Next".

Select "Astraptes fulgerator complex sample data.csv":
Check that the data is formatted correctly and click "Next".
Give your table a name and click "Finish".

Map the data

Fusion Tables auto-detects location data in a table and displays a tab called "Map of <location column name>." In this case, the Map tab is titled "Map of latitude."
  1. Click "Map of latitude."
  2. The map appears, with several small red placemarks scattered across the countryside.
  3. Click a placemark to view the default info window for that row.

Customize the info window template [optional]

The default info window template automatically uses the first ten columns for this table, but you can customize which data appears and how it is displayed:

  1. Click on the Map tab and choose "Tools > Change map", then click the "Change info window" button.
  2. You can experiment by checking column checkboxes to add or remove information from the Automatic info window template.
  3. To customize the overall style and content of the info window template, click the "Custom" tab. The HTML for the default (automatic) columns is displayed to get you started.
  4. To see how you can change the info window display, copy and paste the code below.

Tip: To display the same text in every info window, just add the text to the template here.
Tip: To insert the value contained in a column, indicate the column by using its name inside curly brackets. For example, to display the species name in the info window, put {herbivore species} into the template.

<div class="googft-info-window"
    style="font-family: sans-serif; width: 330px; height: 20em; overflow-y: auto;">
  <img src="{URL cp lateral}"
       style="width: 150px; vertical-align: top; margin-right: .5em" />
  <img src="{URL adult}"
       style="width: 150px; vertical-align: top" />
  <h2 style="color: brown">{herbivore species}</h2>
  <p>Caterpillar found feeding on host plant
     <em>{host plant species}</em>,
      {host plant family} in the {primary eco},{year}.</p>
  <p>See specimen record {voucher} at
      <a href="http://janzen.sas.upenn.edu/">
      Caterpillars, pupae, butterflies and moths of the A.C.G.
      </a>
  </p>
</div>
Click "Save".

Now click a placemark on the map to see your styled info window. This template is much easier to read.

Change placemark icon:
https://support.google.com/fusiontables/answer/2679986?hl=en&ref_topic=2592806

Fusion Tables Example Gallery:
https://sites.google.com/site/fusiontablestalks/stories


--------
Ref: (old) http://www.makeuseof.com/tag/7-ways-to-make-a-google-map-using-google-spreadsheet-data/

Tuesday, November 8, 2016

optimiser son blog (i.e. blogger) avec les en-têtes (headings, headlines,HTML tags h1, h2, h3, h4.

Il est important d'utiliser les systèmes des paragraphes pour un blog.
http://www.w3schools.com/tags/tag_hn.asp
les HTML <h1> to <h6> Tags.

Ils sont importants pour de très nombreuses raisons:
http://www.w3schools.com/html/html_headings.asp

Dans blogspot, Blogger (post page) utilise cette heading distribution:
<h1>Blog Title</h1> et Post-Title
<h2>Sidebar Gadget title</h2>
C'est bizarre mais c'est comme cela! Par contre la talle de la police de caractère est plus petite pour les "Sidebar Gadget title" (voir ci-contre).
Les <h1> à <h6> tags sont aussi utilisés pour définir les  HTML en-tête "headings".
Par défaut ils apparaissent en gras avec une taille décroissante si on utilise seulement le style suivant:
<h3> mon texte </h3> et aucun changement dans son "template".

Comment modifier l'apparence des titres des articles : changer la police, la taille, la couleur, ajouter une image en fond:
https://ladybirdr.blogspot.fr/2014/11/personnaliser-et-ajouter-une-image-aux.html
http://www.leblogger.com/2011/11/entetes-h2-h3-h4-article-referencement.html

En changeant le template (ajout de 7 lignes, voir ci-dessous)
on obtient (h1 est pour le titre du post, voir ci-dessus)

h2

h3

h4

Dans l'éditeur de blogger, il n'est pas wysiwyg, les en-têtes apparaissent en gras et de taille différente.

Pour installer cette mise en forme des en-têtes:

1/ aller dans template, le sauvegarder puis un clic sur edit HTML:
Un clic sur *** pour dérouler la mise en forme de votre blogspot (c'est le bloc CSS) : 
 Aller à la fin de ce bloc et mettre les "7 lignes" just'avant ]]><b:skin>

Les "7 lignes" sont les suivantes:
h2 { font-size: 22px; font-weight: normal; border-style: solid; border-left: 7px solid red;border-width: 0 0 0px 7px; background-color: #fcfcfc; padding: 3px; margin-top: 10px; }
h2.date-header { font-size: 15px; font-weight: normal;border-style: hidden;background-color:#ffefdb;}
h2.title { font-size: 15px; font-weight: normal;border-style: hidden;background-color:#ffffff;}
h3 { font-size: 20px; font-weight: normal; border-style: solid; border-color: #ccdef0; border-width: 0 0 2px 5px; padding: 3px; margin-top: 10px; }
h3.post-title { background-color: #eedfcc; font-size: 22px; font-weight: normal; border-style: solid; border-color: #555500; border-width: 0 0 2px 10px; padding: 5px; margin-top: 10px; }
h4 { font-size: 18px; font-weight: normal; border-style: solid; border-color: #eedfcc; border-width: 0 0 1px 3px; padding: 3px; margin-top:10px; margin-bottom:5px; }
h5 { font-size: 15px; border-style: solid; border-color: #555500; border-width: 0 0 2px 0px; padding-left: 3px; }

Remarques:

la balise <hr> signifie un changement thématique majeur dans la page (barre horizontale).

Utilisation de scoped (The scoped attribute is new in HTML5):
http://www.w3schools.com/tags/tryit.asp?filename=tryhtml5_style_scoped

Jusqu'au tag h4, on peut changer leur style avec class, dir, id, lang, style, title:
http://www.websitesbymark.co.uk/posts/the-h4-html-tag/
 id and class attributes sont liés au CSS styling stocké dans le <head> de la webpage ou dans un fichier externe.

mapbox and tourism travel. Many examples of mapbox.js


https://www.mapbox.com/industries/travel/

mapbox develop many apps:
https://www.mapbox.com/products/

software platform:
https://www.mapbox.com/blog/mapbox-unity-sdk/

a lot of examples:

useful for story maps:
https://www.mapbox.com/mapbox.js/example/v1.0.0/
https://www.mapbox.com/mapbox.js/example/v1.0.0/animating-flight-paths/
https://www.mapbox.com/mapbox.js/example/v1.0.0/marker-movement/
https://www.mapbox.com/mapbox.js/example/v1.0.0/rotating-controlling-marker/

https://www.mapbox.com/mapbox.js/example/v1.0.0/custom-popup/

https://www.mapbox.com/mapbox.js/example/v1.0.0/show-marker-as-label/
https://www.mapbox.com/mapbox.js/example/v1.0.0/custom-popup-style/

https://www.mapbox.com/mapbox.js/example/v1.0.0/timeline-scaled-markers/

Draw lines between markers
https://www.mapbox.com/mapbox.js/example/v1.0.0/line-marker/

Automatically center and show markers in a loop:
https://www.mapbox.com/mapbox.js/example/v1.0.0/cycle-markers/

Using the torque library and data from a CartoDB table:
https://www.mapbox.com/mapbox.js/example/v1.0.0/torque-temporal-data/

import:
https://www.mapbox.com/mapbox.js/example/v1.0.0/load-geojson/
https://www.mapbox.com/mapbox.js/example/v1.0.0/omnivore-csv-simplestyle/


very good:
https://www.mapbox.com/mapbox.js/example/v1.0.0/markers-with-image-slideshow/

mapbox.js

https://www.mapbox.com/mapbox.js/api/v2.4.0/
https://github.com/mapbox/mapbox.js/

police google font et blogspot blogger. Astuces pour les images.


Google Fonts

Google Fonts makes product and web pages run faster by safely caching fonts without compromising users’ privacy or security. Our cross-site caching is designed so that you only need to load a font once, with any website, and we'll use that same cached font on any other website that uses Google Fonts.
Using the code generated by Google Fonts, our servers will automatically send the smallest possible file to every user based on the technologies that their browser supports. For example, we use WOFF 2.0 compression when available. This makes the web faster for all users—particularly in areas where bandwidth and connectivity are an issue. Now everyone can enjoy the same quality and design integrity in their products and web pages, no matter where they are in the world.

Collaborate with Open Source

All the fonts in our catalog are free and open source, making beautiful type accessible to anyone for any project. This means you can share favorites and collaborate easily with friends and colleagues. Google Fonts takes care of all the licensing and hosting, ensuring that the latest and greatest version of any font is available to everyone.
https://fonts.google.com/
https://github.com/google/fonts

You can download all Google Fonts in a simple ZIP snapshot (over 250Mb) from https://github.com/google/fonts/archive/master.zip

http://karlajaramillo.github.io/2015/03/16/make-beautiful-websites-using-google-fonts/

For blogger blogspot:

https://ladybirdr.blogspot.fr/2016/09/utiliser-des-polices-google-fonts.html#more
http://blogavecblogger.blogspot.fr/2014/02/images-et-photos-astuces.html


web clipboard and google drive. Clipboard Image or text. L'usage du web clipboard dans drive.

Copy and paste in Google Docs becomes a lot more powerful when using the web clipboard, allowing you to queue items to paste and add tables or charts to a document.
You can copy and paste text and images between your files — even if you're going from one type of file to another.
Content you copy to the web clipboard is stored on Google's servers and stays there 30 days from when you last took action on it, like when you copied it.

https://support.google.com/docs/answer/161768?hl=en
http://gappstips.com/google-drive/advanced-copy-and-paste-with-web-clipboard/

Si il n'y a rien de copié avec l'usage de Web clipboard "nothing to copy":


Si vous avez copié plusieurs choses par exemple le smiley puis un texte puis une photo insérée (qui est considérée ici comme une shape):

Remarque: la shape sélectionnée ici apparait en pop-up en bas...
On peut copier plusieurs objets d'un seul coup-->qui devient un objet "shapes".
----------

inside your browser:

http://clipboardtodrive.1bestlink.net/
Clipboard Image to Google Drive
Save clipboard images, screen capture to Google Drive directly. This app allows you to one-click saving clipboard images to Google Drive. This is a simple and powerful image, photo saver for Google Drive.
You don't need to install any further software, extension to save clipboard images.
Provides connect with Google Drive. This app only supports Chrome, Firefox, IE11+, Edge.
Firefox, IE11+, Edge browser: Give a focus to the input box, and Press the Ctrl+V.
Press the Ctrl+V, AppleKey+V after copying the image.  
Paste from clipboard for Firefox, IE11+, Edge.
Screen Capture to Clipboard
Windows, Linux: Press PrtScn Button
Mac: Control + Command + Shift + 3 (fullscreen), Control + Command + Shift + 4 (selection)


Monday, November 7, 2016

un powerpoint (.ppt drive) sur le marketing du tourisme

Le marketing = ensemble des activités destinées à :

  • étudier et prévoir les besoins des consommateurs ou clients, tout en évaluant le potentiel du bien ou du service
  • créer et améliorer un bien ou un service pour un marché particulier
  • offrir le bien ou le service au bon endroit


Sunday, November 6, 2016

The Ultimate Guide to Markdown and how to publish on your blog.

Markdown is a plain text formatting syntax for writers. It allows you to quickly write structured content for the web, and have it seamlessly converted to clean, structured HTML.


Back in 2004, Apple pundit John Gruber came up with the idea after becoming frustrated by writing long, laborious HTML tags to properly format his content. He devised a simple writing system which would make web based documents both easier to write, and easier to read in their raw state.


https://blog.ghost.org/markdown/


use a browser extension (or web app) for your blogs

StackEdit 

https://stackedit.io/editor
https://chrome.google.com/webstore/detail/stackedit/iiooodelglhkcpgbajoejffhijaclcdg
the Markdown editor powered by PageDown

- Synchronize with Google Drive or Dropbox
- Publish directly on GitHub, Gist, Blogger, WordPress, Tumblr or any SSH server
- Google Drive multiple sign in

Cons: bad function for inserting an image.

> NOTE:
> Documents are stored in the browser's local storage, which means they are not shared between different browsers/computers. Furthermore, clearing your browser's data may delete all your local documents.
> Full access to Dropbox or Google Drive is required to be able to import any document in StackEdit. Imported documents are downloaded in your browser and are not transmitted to a server.


StackEdit is a free, open-source Markdown editor based on PageDown, the Markdown library used by Stack Overflow and the other Stack Exchange sites.

### StackEdit can:

 - Manage multiple Markdown documents online or offline
 - Export your documents in Markdown, HTML or PDF and format it using a template
 - Synchronize your Markdown documents in the Cloud
 - Edit existing Markdown documents from Google Drive, Dropbox and your local hard drive
 - Post your Markdown document on Blogger/Blogspot, WordPress, Tumblr
 - Publish your Markdown document on GitHub, Gist, Google Drive, Dropbox or any SSH server
 - Share a link to a Markdown document that renders it in a nice viewer
 - Show statistics about your document
 - Convert HTML to Markdown

### Features:

 - Real-time HTML preview with Scroll Link feature to bind editor and preview scrollbars
 - Markdown Extra/GitHub Flavored Markdown support and Prettify/Highlight.js syntax highlighting
 - LaTeX mathematical expressions using MathJax
 - WYSIWYG control buttons
 - Configurable layout
 - Theming support with different themes available
 - A la carte extensions
 - Offline editing
 - Online synchronization using Google Drive (multi-accounts) and Dropbox
 - One click publish on Blogger, Dropbox, Gist, GitHub, Google Drive, SSH server, Tumblr, WordPress