Showing posts with label tourisme. Show all posts

Wednesday, November 30, 2016

faire un fichier CSV ou de transcodage pour l'interopérabilité en vue de faire une "narrative story map"; Choix de la baseMap (tiles) dans odyssey.

Je ne détaillerai pas les différents posts de ce blog sur les histoires narratives cartographiées
utiliser les tags "map" ou "GPS"...

J'ai réalisé un programme pour faire le fichier/données/documents/récits de base et de conversion.

1/ étape flickr

Je télécharge mes images géo-taggées de ma ballade dans Flickr et je met mon choix dans un album
ou s'il y a trop de photos-slides de faire deux albums...

2/ étape écriture

puis un fichier  pour le récit
"name, description"
(name et description n'ont pas de ",")

3/étape transcodage 

  • le transcoder pour le format odyssey.js (ci-dessous)
  • le transcoder pour Story Map Tour (ci-dessous)

pour odyssey.js

les "live examples":
http://cartodb.github.io/odyssey.js/documentation/#the-odyssey-sandbox

le format d'une web slide=
#Adding images to your story
```
- center: [40.7365, -73.9982]
- zoom: 13
L.marker([40.7348, -73.9970]).actions.addRemove(S.map)
```
By default, images are also supported. 
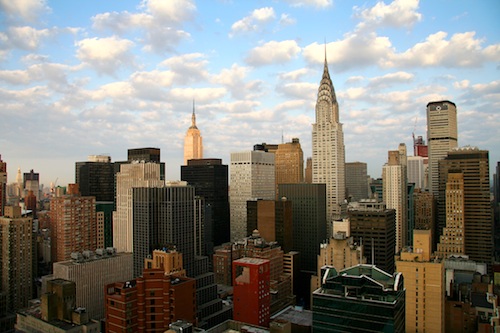
![New York](http://www.boston-discovery-guide.com/image-files/new-york-1.jpg "beautiful!")

Remarque: cette ligne de markdown produit ce code html:
<img src="URL.jpg" alt="New-York" title="beautiful!" />
Lorsque l'on passe la souris sur l'image le texte beautiful! apparait (c'est un hoover popup).
Donc pour chaque image il est préférable de prévoir 3 variable text.
De même pour un lien vers une URL.htm
[Markdown] (http://daringfireball.net/projects/markdown/] "title")
il n'y a pas de "!" pour une URL.htm.

NOTE: There is a known bug in Markdown.pl 1.0.1 which prevents single quotes from being used to delimit link titles.

De plus il est préférable avant la narration de préparer les cartes :
http://mapninja.github.io/CartoDB_Odyssey_Tutorial_for_Story_Maps/
  • Create an empty CartoDB table
  • Populate that table with fields for your data
  • Add the data to your new empty table
  • 'Geocode' your records so that they show up on the map
  • Customize the Pop-up and Hover doo-dads
  • Find your Map ID to put into Odyssey.js
  • Use the Odyssey.js 'Sandbox' to create a basic Story Map
  • Use an historic map from DavidRumsey.com as a basemap in your Story Map
  • Share your Odyssey.js Story Map with a URL, Embed Code, or host it yourself.
Hélas odyssey.js ne gère pas la carte de manière assez fine et repose sur deux 
points pour la carte
-baseurl
-vizjson
par exemple une "History of San Francisco" (que du "hover"):
pour, http://web.stanford.edu/~maples/maps/odyssey/odyssey.html

et pour un super tuto:
avec page "mapninja".github.io et son github: "github.com/mapninja"
https://github.com/mapninja/CartoDB_Odyssey_Tutorial_for_Story_Maps
et aussi son story map fait avec odyssey.js publié sur bl.ocks.org:
http://bl.ocks.org/anonymous/raw/409cb9de4c713e082dee/
il ya du hoover et aussi du popup.
tous ces événements sont dans le vizjson:
```
-baseurl: "http://georeferencer-0.tileserver.com//266b60e098fda1ddbe521ebff0e4d8676a549302/map/CGtnosESWB2NnsgVyjmQc5/201411301752-7AINSs/affine/{z}/{x}/{y}.png"
-title: "The Tattoo Map of San Francisco"
-author: "Stace Maples"
-vizjson: "https://stanfordgeo.cartodb.com/u/stacemaples/api/v2/viz/7840fa14-e940-11e4-bb41-0e49835281d6/viz.json"
```
Ils utilisent  un serveur de tuile pour les cartes anciennes:
http://www.davidrumsey.com/view/georeferencer

Pour renvoyer les informations "popup" suite à un événement click ou hover, c'est avec cartoDB.
Avec cartoDB, on peut choisir son format des data, par exemple:

Our blank table already has description and name fields, so we don't need to add those. We do want to add images to our pop-ups, as well as links our image sources and maybe even links to other websites with more information on the subject of the points we input. Let's add columns for those...
Add the following columns using the Add new column dialog box (just click the Add Column button again for each one):
  1. Description
  2. 'img_url1' with a type of 'string'
    (this will hold the URL for the image you want to show up in your pop-up)
  3. 'img_url1_src' with a type of 'string'
    (to hold the URL of the website you got the image from)
    If you want more than one image per pop-up, just add more sets of 'img_url#' and 'img_url#_src' columns, iterating the number (not too many, though, you'll be able to insert images into the narrative text of your Odyssey.js Story Map)
  4. 'link_url1' with a type of 'string'
    (This will hold a URL to link out to other sources of information)
  5. Again, if you want more links, just iterate the 'link_url#' column
  6. 'latitude' with a type of 'number'
  7. 'longitude' with a type of 'number'
Voir cet exemple avec google drive spreadsheets:

  • soit on exporte en .CSV (en le sauvegardant sur son ordi).
       puis on importe dans CartoDB. 
  • soit on importe directement ce fichier google drive (le nom du fichier est gardé; en fait il est importé en .CVS).
On obtient:


Attention cartoDB odyssey est  en (Lat, Long) par cette façon de rentrer les données 
(Rem: GeoJSON est en (Long,Lat)). 
Je vous conseille de mettre une colonne avec le titre The_geom et de mettre le string suivant avec ce format:
{"type":"Point","coordinates":[4.123694,45.142316]}
 avec en dernier la Longitude, ici 45.
Garder les deux colonnes séparées de chiffres avec les titres lo et la (pas Long ni Lat comme titre de colonne sinon cartoDB génère une erreur d'inversion) pour de futur interopérabilité de votre fichier excel.

Regarder votre data si tout va bien. Les titres doivent être en ASCII.
Il faut maintenant éditer une map (sur le bouton vert en bas à droite).
puis clicker sur le bouton (ici en vert):
puis choisir les effets pop-up (et legend) et aussi les styles des points


relier la Visualisation CartoDB avec Odyssey.js

La première des choses vise l'utilisation de l'option vizjson dans la configuration de votre Odyssey.js markdown. Ainsi vous avez besoin du JavaScript API URL de votre visualisation.

Il faut aller dans votre CartoDB page et votre visualisation pour un click sur le "Share button" (en bas).
Hélas avec la V3 de de cartoDB.js (et builder; cartoDB est en v3.15 en oct 2016) et odyssey.js (qui date de 2013-2014), nous n'avons plus l'export comme dans
http://mapninja.github.io/CartoDB_Odyssey_Tutorial_for_Story_Maps/
https://carto.com/blog/map-of-the-week-an-odyssey-js-story-by-loomstate/
(a post of jul 2014)
voir:
http://gis.stackexchange.com/questions/218606/is-there-a-way-to-get-a-viz-json-url-from-carto-builder

The CARTO Builder does not have the option to share the viz.josn URL due to the current version of CARTO.js (v3.15) is not compatible with the Builder. The new version of CARTO.js (v4) will be released by March/April and it will be compatible with the CARTO builder.

Changer de baseMap pour odyssey

On a de nombreux serveurs de baseMap:
http://wiki.openstreetmap.org/wiki/Tiles

On a 3 choix dans le sandbox d'odyssey: nokia est la moins mauvaise...
c'est l'ensemble des choix par défaut dans cartoDB editor:
  • https://cartocdn_a.global.ssl.fastly.net/base-light/{z}/{x}/{y}.png
    qui est vraiment très light!! mais "unlimited use permitted" et en lien avec OpenStreetMap.
  • une autre du provider Stamen: http://{s}.tile.stamen.com/watercolor/{z}/{x}/{y}.jpg
    essayez (chargement lent):
    http://tile.stamen.com/terrain/{z}/{x}/{y}.jpg
    http://maps.stamen.com/#terrain/12/37.7706/-122.3782
  • une autre du provider ex-nokia, maintenant HERE ("nokia day"):
    https://2.maps.nlp.nokia.com/maptile/2.1/maptile/newest/normal.day/{z}/{x}/{y}/256/png8?lg=eng&token=A7tBPacePg9Mj_zghvKt9Q&app_id=KuYppsdXZznpffJsKT24
    (vendu en 2015): https://wego.here.comhttps://fr.wikipedia.org/wiki/HERE_WeGo
    essayer le mode hybrid:
    "https://2.maps.nlp.nokia.com/maptile/2.1/maptile/newest/hybrid.day/{z}/{x}/{y}/256/png8?lg=eng&token=A7tBPacePg9Mj_zghvKt9Q&app_id=KuYppsdXZznpffJsKT24"
Rem:'http://{s}.somedomain.com/blabla/{z}/{x}/{y}.png'
{s} means one of the available subdomains (used sequentially to help with browser parallel requests per domain limitation; subdomain values are specified in options; a, b or c by default, can be omitted), {z} — zoom level, {x} and {y} — tile coordinates.
Ref: http://leafletjs.com/reference.html#popup

https://developer.here.com/rest-apis/documentation/enterprise-map-tile/
https://developer.here.com/rest-apis/documentation/enterprise-map-tile/topics/example-hybrid-map.html

vous pouvez aussi copier/coller celles-ci de cartoDB:
http://a.basemaps.cartocdn.com/light_all/{z}/{x}/{y}.png
http://a.basemaps.cartocdn.com/dark_all/{z}/{x}/{y}.png

le plus important est de bien choisir en fonction de ses besoins.
Personnellement je préfère openstreetmap car très complète:
http://{s}.tile.openstreetmap.org/{z}/{x}/{y}.png
et aussi une carte "france" :  http://{s}.tile.openstreetmap.fr/osmfr/{z}/{x}/{y}.png
http://wiki.openstreetmap.org/wiki/FR:Servers/tile.openstreetmap.fr
voir les choix:
http://leaflet-extras.github.io/leaflet-providers/preview/

Il faut comprendre qq différences avec "tileset":
A "tileset" typically includes enough tiles to form a very large image, if they were shown all at once, and also several zoom levels. Generally the idea is not to show them all at once, but to display a particular area of the map on a website. Normally this is done using a JavaScript map library to provide panning and zooming functionality, and request downloading of new tiles as necessary to show the user new areas of the map (a Slippy Map). (http://wiki.openstreetmap.org/wiki/Slippy_Map)
Faire sa baseMap personnalisée:

voir mon post:
http://stephane-mottin.blogspot.fr/2016/11/faire-un-fichier-csv-ou-de-transcodage.html


--------------


On peut aussi faire son propre tiling:
http://www.maptiler.org/google-maps-coordinates-tile-bounds-projection/

Il existe des outils de conversion entre le format X/Y/Z et TMS:
The difference between XYZ and TMS tiles and how to convert between them
https://gist.github.com/tmcw/4954720


https://en.wikipedia.org/wiki/Tiled_web_map

-----Rem:
On peut aussi changer l'apparence de la map avec les tests conditionnels du CSS via le zoom par exemple:
http://cartodb3.rssing.com/chan-32620984/all_p2.html
It is easy to change the content of your story map by using conditional zoom visualizations in the CartoDB CSS interface. Here is a snippet from the Berlin Map (https://carto.com/blog/berlin-wall-post/; https://gist.github.com/namessanti/e7432a85159fca12978e ; http://bl.ocks.org/namessanti/e7432a85159fca12978e )
we shared above:
line-opacity:1;[zoom=17]{polygon-fill:#F11810;polygon-opacity:0.4;}[zoom=15]{polygon-fill:grey;polygon-opacity:0.4;}[zoom=10]{polygon-fill:grey;line-color:#808080;}
This code changes the visualization at zoom level 17, 15, and 10 to represent the parameters identified below the [zoom = ] section.
When you bring your CartoDB map into Odyssey.js, those conditions remain on your map and make it easy to change the appearance of your map by simply moving the zoom and assigning a story panel. You can play around with all sorts of conditional CartoCSS parameters
https://github.com/mapbox/carto/blob/master/docs/latest.md

Si on veut plus, il faut un peu de code dans le config block.

Ref: http://mapninja.github.io/CartoDB_Odyssey_Tutorial_for_Story_Maps/

pour Story Map Tour (ESRI)

une web_slide= les colonnes suivantes avec un return à la fin:
name,description,icon_color,long,lat,pic_url,thumb_url,is_video
exemple:
Welcome to the reserve,
"The reserve is managed jointly. The Kendall Frost Mission Bay Reserve is part of the University of California Natural Reserve System (UC NRS) and is managed by the University of California San Diego (UCSD). The adjacent Northern Wildlife Reserve is managed by the City of San Diego. <i><a href=""http://nrs.ucsd.edu/kendall.html"" style=""color:yellow"" target=""_blank"">More Info</a></i>",
R,
-117.2296755,32.7920955,
http://downloads.esri.com/blogs/places/missionbaymarsh/marsh_intro_picture.jpg,
http://downloads.esri.com/blogs/places/missionbaymarsh/marsh_intro_picture_thumbnail.jpg,

avec au max 99 lignes.

le zoom (et centrage) sera à mettre slide par slide...

pour le javascript, on peut voir:

pour Story Map Knightlab

si on ne veut pas utiliser leur éditeur slide par slide, il faut plonger dans leur structure JSON.

La structure de la web_slide est:
{
    type: "overview",      // optional; if present must be set to "overview"
    location: {            // required for all slides except "overview" slide
        lat: decimal,      // latitude of point on map
        lon: decimal       // longitude of point on map
    },
    text: {                // optional if media present
        headline: string,
        text: string       // may contain HTML markup
    },
    media: {               // optional if text present
        url: string,       // url for featured media
        caption: string,   // optional; brief explanation of media content
        credit: string     // optional; creator of media content
    }
}
La structure de gestion de l'array de cet objet "slide" est:
{
    width: integer,                // required for embed tool; width of StoryMap
    height: integer,               // required for embed tool; width of StoryMap
    font_css: string,              // optional; font set
    calculate_zoom: true,              // optional; defaults to true.
    storymap: {
        language: string,          // required; two-letter ISO language code
        map_type: string,          // required
        map_as_image: false,       // required
        map_subdomains: string,    // optional
        slides: [object]           // required; array of slide objects (see below)
    }
}

Timeline Knightlab

Rem: l'utilisation de leur célèbre timeline est possible.
Elle se fait avec un fichier tableur
mais hélas les cartes sont à faire puis une URL dans une case du tableur...
Une carte par exemple une google map ou une cartoDB (avec l'excellent builder; voir ci-dessous), peut être mise sous forme de link_URL. 

le fichier tableur doit être stocké dans Google Drive, voir ici le template:

Year ,Month, Day, Time, End Year, End Month, End Day, End Time, Display Date, Headline, Text Media, Media Credit, Media Caption, Media Thumbnail, Type, Group, Background
soit 16 colonnes.
dans media ce sont des URL.
dans media caption: du texte ou par exemple <a href="http://www.flickr.com/photos/zachwise/6115056146/" title="Chicago by zach.wise, on Flickr">Chicago by zach.wise</a>


JackDougherty/leaflet-storymap or mapbox (2016)

Scroll-driven story map, with point markers and narrative text in GeoJSON, using Leaflet and jQuery.
https://github.com/jackdougherty/leaflet-storymap

  • Scroll-driven navigation, using screen swipe, trackpad, or keyboard down-arrow. Initial map displays all point markers.
  • Viewers can pan and zoom the map independently of the narration, or click on any point to go directly to that chapter.
  • Easy-to-learn template to create your own storymap. Upload text, point coordinates, zoom levels, and image links to a CSV generic spreadsheet, and drag into http://geojson.io to create a GeoJSON data file.
  • Images can be stored in local subfolder or pulled from an external URL.

Due to GeoJSON data limitations, there is no easy way to insert hyperlinks inside the 'description' text. They must be created outside, in fields such as "source-link".
Then there are no hover or popup events on the map...

The HTML code in the demo map is very well documented. if you have used Leaflet.js before then you should be easily able to use the template and even adapt it for your own use. The 'read me' file on  leaflet-storymap's GitHub page also contains a number of useful links to other story map templates.

with mapbox:
http://jackdougherty.github.io/mapbox-storymap/index.html

marker/pulse (animated) 3 choices of basemap:
http://jackdougherty.github.io/mapbox-storymap/pulse.html
no UI events on the map.

Examples with Added Features

Explore http://pembrokesoundscapes.ca/map, view code at https://github.com/rblades/rblades.github.io. Added audio playback in the narrative, historical map layers.
no UI events on the map.

Story Mapbox GL.js

A very quick way to create an effective scroll-driven story map is to use Mapbox GL. The advantage of using Mapbox GL over some other mapping libraries is that Mapbox GL allows you not only to zoom and pan the map but to rotate the map to provide different perspectives on your featured locations

If you want to create a Mapbox GL story map there is also the added advantage that Mapbox has provided a great template in their list of 'example' maps. The Fly to a location based on scroll position map in the Mapbox GL examples (https://www.mapbox.com/mapbox-gl-js/example/scroll-fly-to/) provides a neat demo of the possibilities of a Mapbox GL story map (all you have to do to create your own story map is copy & paste the provided code and change the content to suit the story you want to tell).
An example of story map (without UI events):
https://www.mapbox.com/mapbox.js/example/v1.0.0/scroll-driven-navigation/
An example: Slideshow gallery in a marker tooltip; Add a custom slideshow to a marker's tooltip.
https://www.mapbox.com/mapbox.js/example/v1.0.0/markers-with-image-slideshow/

This JavaScript library uses WebGL to render interactive maps from vector tiles and Mapbox styles. We found out how to to configure the color mapping on the client side and minimize data traffic while rendering a lot of data (https://www.ubilabs.net/en/news/data-driven-raster-layer-mapbox-lg-2016-09-05).

http://carlapedret.github.io/jewellerymap/
A beautiful example of a Mapbox GL story map is Birmingham Eastside's Gentrification in Birmingham’s Jewellery Quarter. Birmingham Eastside has used the Mapbox GL demo map to create a mapped guide to how gentrification is affecting Birmingham's Jewellery Quarter.
As you scroll through the map you are taken on a tour of the neighborhood, highlighting some of the biggest changes in the area. The Gentrification in Birmingham's Jewellery Quarter map also features map markers which provide another level of interactivity to the map. These markers provide additional information and media - such as audio recordings of interviews with some of the individuals featured in the side-panel content.
https://github.com/carlapedret
only copy/paste in html (in GitHub and after to github.io hosted pages http://carlapedret.github.io/jewellerymap/).

https://www.mapbox.com/bites/00110/
Mapbox have also used their own story map format to create a map of the intriguing case of Robert Durst. Durst was arrested on a first-degree murder warrant. If convicted he could face the death penalty.
Following the Life and Death of Robert Durst plots the key movements and actions of Robert Durst since his first wife 'disappeared' three decades ago up until his arrest in New Orleans. As well as the scroll-driven narration and up-dating map 'Following the Life and Death of Robert Durst' uses map markers and polylines to track Durst's movements around the country and to connect all the featured locations together.
-->no UI events on the map.


Ref: http://googlemapsmania.blogspot.fr/2016/08/mapbox-story-maps.html

Tools

---------------
Tools markdown/HTML
(Convert HTML to Markdown...)

Rem:
Remember that GeoJSON stores coordinates in "reversed order" (longitude, latitude)


Friday, November 18, 2016

INTEROPERABILITE des STORY MAPS et odyssey.js (et Flickr)

INTEROPERABILITE des STORY MAPS

Lorsque l’on réalise une « narrative story map » une histoire/ballade cartographie narrative, le plus long consiste à écrire du texte de qualité et référencé. 
Il faut pouvoir sauvegarder ce texte (avec ou sans mise en forme) et sa story map narrative d’un bloc . 

J'ai réalisé plusieurs post sur les story maps (voir le tag "GPS" ou "map" de ce blog) y compris une synthèse des divers stratégies. Ici c'est mon choix actuel dans la perspective de l'interopérabilité de ce long travail d'écriture et de collecte des médias.

odyssey.js,

Avec odyssey.js, (https://cartodb.github.io/odyssey.js/) nous pouvons mettre en forme le fichier markdown avec un éditeur de texte comme notepad++ , textedit  BBEedit avec extension markdown (ou d’autres logiciels markdown, voir tag de ce blog « markdown »voir MS word ou google doc… On peut utiliser du HTML pour mettre en forme du texte de manière plus poussée. Voir aussi mes autres posts plus détaillés sur ce javascript et les web services associés (tag "GPS" ou "map" ou "markdown" de ce blog).
Je rappelle ici que markdown est un langage simple pour écrire du texte alors que HTM est un langage à balise plus compliqué (et plus lourd)  fait pour la visualisation.
Pour insérer les données Latitude,Longitude et les URL des images, il faut mettre en forme avant l’écriture du fichier markdown.
Plutôt que du copier/coller pour chaque URL image/video (son seul est un cas particulier) et chaque marqueur Lat,Long, il faut au préalable télécharger par batch des lots d’images qui gère le géo-taggage.
Pour cela plusieurs possibilités:

batch des lots d’images qui gère le géo-taggage

1/Créer un blogspot privé où vous incorporez/télécharger vos images. Puis dans l’HTML, récupérer la liste des URL et filtrez le fichier avec MS word excel ou google doc ou sheet par exemple (sauvegarder aussi en .CSV). 

Je pense que l’on peut aussi le faire avec Flickr qui permet de vérifier la géo-localisation via l’affichage d’une carte de ces photos…
Mais il ne peut le faire directement.
Il faut passer par la fonction API flickr.photosets.getPhotos de l’API Flickr:
on peut récupérer les "id" de toutes les photos d'un album (set en anglais)  (500 photos max dans un album) dans un fichier simple qui est de 4 types possibles:
  •  XML (XML-RPC; http://xmlrpc.scripting.com/  )
  •  JSONP  (JavaScript Object Notation, est un format simple d'échange de données assimilable par l'ordinateur, qui facilite l'élaboration d'applications en JavaScript avec l'API  json.org )
  •  JSON
  •  PHP Serial (fichier .mdlp)

un clic en bas sur Explorateur API : flickr.photosets.getPhotos
donne ceci:

Que la liste de toutes les Id des photos, de leur titre, ici en XML (à partir du propriétaire_id 144398584@N07: et du photoset_id 72157676525638806: 
<rsp stat="ok">
  <photoset id="72157676525638806" primary="25373090639" owner="144398584@N07" ownername="stef42530" page="1" per_page="500" perpage="500" pages="1" total="6" title="velay-test1">
    <photo id="25373090639" secret="xxxxx" server="5344" farm="6" title="yssingeaux" isprimary="1" ispublic="1" isfriend="0" isfamily="0" />
    <photo id="22808772578" secret="xxxx" server="5815" farm="6" title="fontaine" isprimary="0" ispublic="1" isfriend="0" isfamily="0" />
    <photo id="30973507366" secret="xxxx" server="5347" farm="6" title="statue Marie" isprimary="0" ispublic="1" isfriend="0" isfamily="0" />
    <photo id="30707294970" secret="xxx" server="5653" farm="6" title="la croix de mission" isprimary="0" ispublic="1" isfriend="0" isfamily="0" />
    <photo id="30870710272" secret="xx" server="5498" farm="6" title="communauté pays des sucs" isprimary="0" ispublic="1" isfriend="0" isfamily="0" />
    <photo id="30973523796" secret="xx" server="5483" farm="6" title="eglise de champclause-nonReduit" isprimary="0" ispublic="1" isfriend="0" isfamily="0" />
  </photoset>
</rsp>
On a bien les 6 photos.

Et les URL et les Lat,Long des photos d'un album?

A partir de cette liste des photo_id, avoir les URL c'est simple (voir ci-dessous  flickr.photos.getInfo).
www.flickr.com/photos/144398584@N07/25373090639/

Pour les données de Lat,Long et avec  flickr.photos.geo.getLocation ce n’est que par une seule photo:
photo par photo. Donne aussi les Place_id et woeid (nom ville, région, pays; voir ci-dessous):

idem photo par photo via une Id de photo.
On a dans un même fichier les données géo et l'URL. 
On peut donc le traiter facilement pour le mettre dans un fichier excel.
Ce fichier text retourne Lat, Long et aussi URL complète avec aussi 
le nom de l' Id propriétaire (ici 144398584@N07) et Id photo (25373090639):

<url type="photopage">https://www.flickr.com/photos/144398584@N07/25373090639/</url>

pour les données géo:
<location latitude="45.142316" longitude="4.123694" accuracy="16" context="0" place_id="2357Wa9XUbm_ZCg" woeid="633062">
      <locality place_id="2357Wa9XUbm_ZCg" woeid="633062">Yssingeaux</locality>
      <county place_id=".z9.tGJQUL8BHZ7KeQ" woeid="12597130">Haute-Loire</county>
      <region place_id="6VHmZr5WU7.XrIHq" woeid="7153310">Auvergne</region>
      <country place_id="lbWye9tTUb6GOcp80w" woeid="23424819">France</country>
    </location>

Pour les données EXIF complètes hélas d’une seule photo, on peut utiliser:
https://www.flickr.com/services/api/explore/flickr.photos.getExif

Sinon pour une manipulation des URL flickr et affichage d'un album en défilement, voir mon petit code javascript:
http://jsdo.it/ex-ample.blogspot/uLfn/edit
Pour les données Lat,Long de nombreuses photos: on peut aussi utiliser des outils de conversion des données EXIF par lots: voir d’autres post de ce blog (tag EXIF ou GPS).

Les édtiteurs web

2/On peut utiliser ArcGis story journal (ou cascade) qui incorpore les images géo-taggées par lot via flickr  (ou google picasa (fonctionne pas bien en cette fin 2016) ou via un t-fichier tableur .CSV. Générez la story map sans mettre du texte un par un. Cette méthode permet de ne pas gérer directement les URL et les (Lat,Long), le builder s’en occupe.


Conclusion

Bref, avec cette solution odyssey.js, le plus important est que l’on peut sauvegarder directement son travail sous deux formes:
a/ le fichier markdown (.md et bien sur son transcodage .HTML avec par exemple un « Rich Text Editeur »)
b/ le site web (et son javascript) hébergé.

c) une troisième  si on utilise les builders d’ARcGIS online de story map.
Rem: votre fichier markdown peut aussi être traité pour extraire le texte de chaque image pour le mettre dans ce .CSV. Puis on peut refaire une nouvelle story map avec ces ArcGIS builders avec le texte via ce .CSV.
On a alors un troisième format «  site web » de votre story map sous cette forme de site intégré ArcGIS hébergé.
d) de plus vous aurez aussi un quatrième format de fichier de sauvegarde de votre story map en .CSV complet…


Tuesday, November 15, 2016

liste des blogs et sites sociaux de google et une sélection de posts intéressants vis-à-vis de "maps"


Une sélection à partir de :
https://www.google.com/intl/en/press/blog-social-directory.html#tab0

maps

https://blog.google/products/maps/

+picasa-blog (fini) ou photos

+culture


+guides (pour des reviews)

+ Google+


+ opensource


et les classiques 
"developers google":

OpenImages: A public dataset for large-scale multi-label and multi-class image classification

Open Images is a dataset of ~9 million URLs to images that have been annotated with labels spanning over 6000 categories.
Each image has a unique 64-bit ID assigned. In the CSV files they appear as zero-padded hex integers, such as 000060e3121c7305. The dataset is split into a training set (9011219 images) and a validation set (167057 images). Each image has zero, one or more image-level labels assigned.


Thursday, November 10, 2016

Synthèse pour faire un choix pour faire une narrative story map de tourisme pour une ballade avec un appareil photo avec GPS intégré.


J'ai publié de nombreux posts pour les différentes stratégies de faire une story map pour une ballade avec un appareil photo avec GPS intégré (cliquer sur le tag map).
Ici nous avons une synthèse de cette quête.

Ces web services sont du type "avec account" interne style ArcGIS, ou compte google, twitter...
Voir mon autre blob sur les online web services (en anglais):

A propos des trajets dans les bois, sentiers, voir ce post qui date de 2011 et donc qui a vieilli mais qui reste intéressant pour les stratégies concernant les ballades à pieds car il est assez exhaustif:

Ici je m'intéresse au choix interopérable pour la gestion des contenus web (text, images, médias 3D, illustration SVG, slide temporelle et surtout une partie du monde du "map" et de la géomatique au sens général) pour faire une story map narrative touristique.

Le but est aussi de répondre à la question : comment gérer de manière pérenne et interopérable puis publier (de manière différente et sur plusieurs plateformes) une ballade "touristique"  avec X photos prises avec un système intégrant un GPS (ou ayant des données EXIF avec géo-tags, géo-données dans les métadatas de ces photos/video/sons)?

Les 3 possibilités

un fichier markdown avec odyssey.js et son sandbox

Il faut faire un fichier avec le langage markdown .md (mais c'est facile avec le sandbox intégré; on peut toujours insérer du HTML). Plus tard si vous voulez utiliser ce fichier pour une autre application, vous pourrez le transformer en html facilement. Vous pourrez aussi le transformer en fichier excel avec quelques chercher/remplacer des balises et "tab" (ne pas utiliser "tab" dans ce fichier).

Il faut au préalable faire un upload de ses photos et récupérer les données GPS (Lat,Long) et les URL de chaque photos. Je vous conseille de faire un traitement par lot en ajoutant à la fin de nom de chaque fichier Lat,Long avec le format [45.3,4.4] par exemple avec graphic converter ou d'autres images organisateurs. Vous gagnerez du temps. Vous pouvez aussi choisir de manière séquentielle de faire une liste de déplacement de carte et de zoom puis de "ADD" dans le sandbox.

Vous pouvez aussi faire un extract des data GPS et les sauvegarder dans un fichier tableur ou text:
http://stephane-mottin.blogspot.fr/2016/11/takes-directory-full-of-images-export.html

A partir du même fichier markdown on peut faire 2 types de présentation, plus une autre avec le temps. 
Les limitations:
Le pointeur (toujours le même) ne supporte le clic pour afficher un pop-up par exemple.
En fait on ne peut que choisir "nokia day" pour la map (cartoDB light est trop simple) mais on peut activer cette option: 
If you are creating a visualization that uses a CartoDB map, you will see the following options in addition to the default:

  • cartodb_filter
    • The value for the column you want to filter
  • vizjson
If you wish to use a CartoDB data visualization in your story, you will use the “vizjson” option to link to the visualization. The vizjson URL that you need to include here can be found by going to your visualization in CartoDB, clicking “Share” in the upper right corner, and copying the CartoDB.js link. Then paste this link in the vizjson parameter of your Odyssey.js story’s config block. It should look like the example below.- cartodb_filter: "column='VALUE'"- vizjson: "http://{user}.cartodb.com/api/v2/viz/{your-viz-key-here}/viz.json"
mapbox (template de HTML en faire du copier/coller de ses données)
https://www.mapbox.com/studio/signup/?plan=starter
(besoin d'un token...) Il faut copier/coller ses données dans le template en HTML de ces nombreux exemples... https://www.mapbox.com/mapbox-gl-js/examples/
 Ref: http://googlemapsmania.blogspot.fr/2016/08/mapbox-story-maps.html

Leaflet.js. Jack's leaflet-storymap
Jack Dougherty's leaflet-storymap is a great template to use for creating scroll-driven story maps with Leaflet.js.
Jack's leaflet-storymap is an easy to use template for creating a scroll-driven story map in which all the narrative content is loaded from a GeoJSON data file. You can view a demo of the template in action here:
http://jackdougherty.github.io/leaflet-storymap/index.html
https://github.com/jackdougherty/leaflet-storymap
Easy-to-learn template to create your own storymap. Upload text, point coordinates, zoom levels, and image links to a CSV generic spreadsheet, and drag into http://geojson.io to create a GeoJSON data file.
Limitations: due to GeoJSON data limitations, there is no easy way to insert hyperlinks inside the 'description' text. They must be created outside, in fields such as "source-link"...

voir son livre en anglais: https://www.datavizforall.org/ (Tell your story and show it with data.)

Voir aussi:
http://muxlab.github.io/map-effects-100/Leaflet/11_scroll-driven-map-navigation.html
 https://github.com/muxlab/map-effects-100

The HTML code in the demo map is very well documented. if you have used Leaflet.js before then you should be easily able to use the template and even adapt it for your own use. The 'read me' file on  leaflet-storymap's GitHub page also contains a number of useful links to other story map templates.

Les éditeurs avec des boites insert "images" "texte" (philosophie "authoring tool" multiclick): 

Ce sont des "open source"mais pas de sandbox pour ces javascripts "storymap.js".
On a actuellement 3 sociétés:
  • https://storymap.knightlab.com/  avec différents choix de visualisation
  • https://story.mapme.com avec différents choix de visualisation
  • http://storymaps.arcgis.com/fr/
    Les chargements de vos story map sont très longs sauf pour ceux de la web application  "short list" mais qui est trop limitée à mon goût.
    On a de nombreux choix de Story Map Builders (Cascade, Crowdsource, Map Tour...):
    • Story Map Shortlist. Liste organisée de lieux d'intérêt. Présentez un grand nombre de lieux organisés par onglets thématiques, par exemple, restaurants, hôtels et attractions. Lorsque vos utilisateurs explorent la carte, les onglets s'actualisent afin d'afficher uniquement les lieux dans leur étendue de carte actuelle. les photos GPS-taggées ne sont pas reconnues et ils faut mettre à la main l'emplacement soit avec une adresse, nom ou soit avec des coordonnées.
      Essayez et comparez les pages web générées avec votre test (3 images) avec mapme et knightlab.
    • Story Map Cascade, ici les photos GPS-taggées téléchargées sont reconnues et mises au bon endroit sur la carte. Les images que vous chargez à partir du disque sont hébergées dans votre web application Cascade automatiquement. Si vous vous loggez avec votre compte google, les images seront dans le site XXX.googleusercontent.com/YYY.
      Il faut lire le tutoriel car c'est pas évident de gérer les nombreuses possibilités de positionnement des contenus et les cartes.
    • Story Map Crowdsource. L'application Story Map Crowdsource vous permet de publier et de gérer un récit collaboratif auquel tout le monde peut apporter des photos avec légendes. Utilisez-le pour faire participer un public précis ou général sur le sujet de votre choix. Pour contribuer à votre récit, les utilisateurs peuvent se connecter avec leur compte Facebook, Google ou ArcGIS, ou utiliser une option d'invité. Une fonction de vérification vous permet d'examiner et d'approuver les contributions.
      IL FAUT UN ABONNEMENT PAYANT A arcGIS (version d’évaluation gratuite de 60 jours )...
    • Autres (plus simple ou plus spécialisée): http://storymaps.arcgis.com/fr/app-list/
      • MapTour
        Présentez un ensemble de photos ou de vidéos avec légendes, associées à une carte interactive. Elle se prête parfaitement aux promenades ou aux séquences de lieux que les utilisateurs sont invités à suivre dans l'ordre.
        Enter your email address or your ex-Picasa/Photos/Google+ id. Your pictures must be shared publicly. The import will be limited to the first 99 pictures.
        Map Tour Builder http://www.arcgis.com/apps/MapTour/index.html?fromScratch
        ici les photos GPS-taggées téléchargées sont reconnues et mises au bon endroit sur la carte ( si vous avez activé dans Préférences géographiques "tout le monde" : https://www.flickr.com/account/geo/privacy/?donegeopriv=1&from=privacy)
        On peut aussi importer avec un fichier CSV. Voir le template:
        https://raw.github.com/Esri/map-tour-storytelling-template-js/master/samples/csv_file__lat_long/Locations.csv
        C'est séparé par des virgules:
        name,description,icon_color,long,lat,pic_url,thumb_url,is_video
        exemple:
        Jimson Weed,"This is a typical upland marsh plant.",R,-117.2323986,32.7898303,http://downloads.esri.com/blogs/places/missionbaymarsh/jimson_weed.jpg,http://downloads.esri.com/blogs/places/missionbaymarsh/jimson_weed_thumbnail.jpg,
        Rem: 
        Formatting your caption text using HTML tags The header and picture title/caption can include HTML tags to define formatting and links. For example, this code adds a yellow link: <a href="http://storymaps.esri.com/" style="color:yellow" target="_blank">StoryMaps Website</a>
      • Story Map Journal
        Créez une narration détaillée organisée en sections présentées dans un volet latéral déroulant. A mesure que les utilisateurs font défiler les sections dans votre Map Journal, ils voient le contenu associé à chaque section, tel qu'une carte, une scène 3D, une image, une vidéo, etc.
        http://www.arcgis.com/apps/MapJournal/index.html?fromScratch
      • Story Map Series
        1/Mise en page sous forme d'onglets-->  Présentez une série de cartes (donc assez différente, utile aussi pour présenter divers data/thème sur une carte) via un ensemble d'onglets. Un volet descriptif facultatif affiche du texte et d'autres contenus associés à chaque carte--> Mise en page en accordéon latéral
        2/Présentez une série de cartes, ainsi que le texte d'accompagnement et d'autres contenus pour chaque carte, dans un volet pouvant être développé. Le fait de cliquer sur un titre sélectionne la carte et développe le volet pour afficher le texte.
        3/Mise en page sous forme de puces-->  Présentez une série de cartes via des puces numérotées, une carte par puce. Il est conseillé de l'utiliser lorsque vous devez présenter un nombre important de cartes et d'emplacements. Un volet descriptif facultatif affiche du texte et d'autres contenus associés à chaque carte.
      • Story Map Swipe. Permettez à vos utilisateurs de comparer deux cartes Web distinctes ou deux couches d'une seule carte en déplaçant un outil de balayage en avant et en arrière.
      • Story Map Spyglass. Cette application est similaire à Swipe, mais la différence réside dans le fait qu'elle permet à vos utilisateurs de voir une carte à travers une autre grâce à l'outil de longue-vue.


Dans Story Map Cascade, on a un vaste choix de carte. On réalise un clic sur "edit":

qui ouvre cette fenêtre:

Le menu du haut est très riche.
Aller dans "Details": beaucoup de possibilité pour modifier chacun de vos marqueurs par exemple;
et dans "fenêtre contextuelle" affichage d'une autre ou la même image, courbe, histogramme.


Je ne vais pas détailler les menus de "Contenu". Juste vous pouvez voir en bas  une "feuille tableur" qui contient tous les marqueurs de cette "layer",  hélas, en fait c'est une table "HTML". On peut copier le code mais il ne contient pas les données GPS Lat,Long!

Remarquez l'utilisation possible du fond de carte d'openstreetmap.

Pour l'utilisation avec google (post de sept 2016, Picasa and Google Photos: What story map authors need to know):
https://blogs.esri.com/esri/arcgis/2016/09/13/story-maps-and-picasa/
Yes, you can use Google Photos, but it currently requires a little extra effort. As of this blog post, there’s no way to make photos public in Google Photos, but you can do this in Picasa Google+.
Rem: Google+ Creative Kit is an online photo editor integrated to Google+ on October 27, 2011, which is essentially Picnik, integrated earlier to Picasa Web Albums (wikipedia).
In May 2015, Google+ launched “Collections” feature which was inspired by Pinterest. It allows users to "build content collections based on topics and interests".

On peut télécharger de nombreuses photos d'un seul coup qui apparaissent en diaporama dans son mur. On peut aussi les transférer dans une Google+ collection.
En faisant un "post" dans Google+, le téléchargement de photos avec des géo-tag Lat,Long permet de visualiser la position via "information". En cliquant sur la carte on obtient les coordonnées. Les autres données exif (modèle appareil photo et données optiques) apparaissent aussi (aussi pour les photos sans géo-data).
L'importation de photos dans Google+ inclut l'importation des informations stockées dans les images (métadonnées EXIF), notamment leur géolocalisation. Cliquez sur Détails de la photo en mode Lightbox pour afficher les informations relatives aux photos que vous avez importées.
https://support.google.com/photos?visit_id=1-636145364232375376-3774937042&rd=1#topic=6128818
Si il y avait plus d'option, on pourrait utiliser ce service pour faire une story map...
Dans "settings" Photos and Videos Shared on Google+, activez
"Show geo location by default on newly shared Google+ albums".

Voir les "open sources":
https://github.com/Esri
https://github.com/Esri/storymap-crowdsource
First create your Crowdsource story in ArcGIS Online using the step-by-step tutorial. Once your story is ready, you have to find its ID in ArcGIS Online. The ID is a 32 character string that you will find in your web browser's address bar when you are viewing your series (just after appid=).
Download the application
Deploy the application on your webserver.
Edit index.html, find the configuration section on line 24 and paste in your application ID
Navigate to index.html (e.g., https://www.example.org/StoryMapCrowdsource/index.html)

https://github.com/Esri/storymap-cascade
https://github.com/Esri/shortlist-storytelling-template-js
https://github.com/Esri/map-series-storytelling-template-js
View it live:
tab layout
accordion layout http://www.arcgis.com/apps/MapSeries/index.html?appid=ef703d9454bb4e4e8a9c1b086b5b66b5 (sur le gaz de schiste)
bullet layout
https://github.com/Esri/swipe-map-storytelling-template-js
The Story Map Swipe and Spyglass app enables users to interact with two web maps or two layers of a single web map.
https://github.com/Esri/map-tour-storytelling-template-js
https://github.com/Esri/text-and-legend-map-storytelling-template-js (old, now https://github.com/Esri/map-series-storytelling-template-js)
https://github.com/Esri/countdown-storytelling-template-js (old)
http://storymaps.esri.com/templates/countdown/ (The World's 25 Busiest Airports)

https://github.com/Esri/esri-leaflet
https://github.com/Esri/map-and-app-gallery-template
https://github.com/Esri/geotour-js
(interêt de faire une route avec des points d'arrêt
All it requires is a feature service with integer Sequence and string Name fields where records are to be visited in ascending Sequence order.)
https://github.com/Esri/arcgis-osm-editor
https://github.com/Esri/edit-template
Edit is a configurable application template that enables you to provide basic editing capabilites for editable layers in a web map. exemple intéressant (signaler une dégradation: http://www.arcgis.com/apps/Edit/index.html?webmap=25977874c66c4c0a8dcc181506c6fb45
C'est la même fenêtre des menus contextuels pour le marqueur cliqué que pour Cascade.
http://www.arcgis.com/home/item.html?id=2a9fbd75eea14c87a32d3799e00663f2
http://www.arcgis.com/home/search.html?t=content&q=tags:ArcGIS%20web%20application%20template

https://github.com/Esri/geoform-template-js
GeoForm is a configurable template for form based data editing of a Feature Service. This application allows users to enter data through a form instead of a map’s pop-up while leveraging the power of the Web Map and editable Feature Services.

https://github.com/Esri/geojson-layer-js
An easy way to load GeoJSON data into your ArcGIS map
  • Load GeoJSON from a file
  • Load GeoJSON from a server
  • Load GeoJSON data from a FeatureCollection
An easy way to load GeoJSON resources into your ArcGIS map. This is a simple custom layer that uses Terraformer (http://terraformer.io/) to convert GeoJSON to ArcGIS JSON. It "should" support all GraphicLayer operations. e.g. popups, rendering...

https://github.com/Esri/geojson-utils
converting between Esri's Geoservices JSON and GeoJSON
https://github.com/Esri/arcgis-to-geojson-utils
https://github.com/Esri/kml-for-geoevent (pour serveur).

Les éditeurs avec un fichier tableur "base de données"

Ici la base de données est un Google spreadsheet:
le texte accepte du HTML.

C'est la philosophie du:
les feuilles de calcul Google gèrent la gestion de contenu, de sorte que les modifications apportées à vos histoires sont faciles à réaliser sans toucher une ligne de code.
(Google spreadsheets handle content management, so changes to your stories are easy to make without touching a line of code). 
On a la même approche avec par exemple (a very simple content management system):
pour la création de site web.

Il faut au préalable faire un upload de ses photos et récupérer les données GPS (Lat,Long) et les URL de chaque photos. Je vous conseille de faire un traitement par lot en ajoutant à la fin de nom de chaque fichier Lat,Long avec le format [40.7348, -73.9970] par exemple avec graphic converter ou d'autres images organisateurs. Vous gagnerez du temps. 

Vous pouvez aussi faire un extract des data GPS et les sauvegarder dans un fichier tableur ou text:
http://stephane-mottin.blogspot.fr/2016/11/takes-directory-full-of-images-export.html

Les outils javascript "open source" de la knightlab 

Des outils de knightlab comme:
on peut comparer deux images par exemple des jpeg de carte pour voir l'évolution par exemple d'une déforestation.
JuxtaposeJS is a simple, open source tool for creating before/after image sliders. Just provide two image URLs and Juxtapose will do the rest of the work for you.

pour insérer du son dans sa "story".

outils pour analyser les réseaux sociaux.

un bookmarklet javascript pour copier image sur le web et mettre du texte.

Les feuilles de calcul Google gèrent la gestion de contenu, de sorte que les modifications apportées à vos histoires sont faciles à réaliser sans toucher une ligne de code.
(Google spreadsheets handle content management, so changes to your stories are easy to make without touching a line of code). 
On a la même approche avec par exemple (a very simple content management system):
pour la création de site web.
(.dmg pour mac).

template 
The basic setup is for authoring presentations only. The full setup gives you access to all reveal.js features and plugins such as speaker notes as well as the development tasks needed to make changes to the source.

Monday, November 7, 2016

un powerpoint (.ppt drive) sur le marketing du tourisme

Le marketing = ensemble des activités destinées à :

  • étudier et prévoir les besoins des consommateurs ou clients, tout en évaluant le potentiel du bien ou du service
  • créer et améliorer un bien ou un service pour un marché particulier
  • offrir le bien ou le service au bon endroit


Sunday, October 30, 2016

modèles des Story Maps d'arcGIS: quelques story map (excursion, ballade, pèlerinage, voyage, road trip) avec promotion du tourisme d'une région avec ArcGIS Online.


Promotion touristique des territoires, une Story Map vaut mieux qu'un long discours !

En cette période printanière où les week-end rallongés sont propices aux escapades, j'ai regardé un peu comment les utilisateurs d'ArcGIS Online exploitaient les modèles de Story Map pour promouvoir des territoires et faire connaître leur potentiel touristique. Voici un panorama de différentes approches et des exemples de réalisation en France et à l'étranger:

Un beau billet de 2014:
http://www.arcorama.fr/2014/06/valorisation-touristique-une-story-map.html


Selon le modèle de Story Map utilisé, les sites pourront proposer plus ou moins de description et pourront être organisés de manière hiérarchique ou thématique.


cartoDB odyssey.js storymap.js and many examples of "story map" (pour de l'histoire, des voyages, des ballades, des excursions, road trips).

cartodb and odyssey.js 

very good open source (2014):
javascript "cartodb": odyssey.js

When you're ready to go and build the narrative/navigation part of your application. We're going to use Odyssey.js for this. Odyssey.js is actually a JavaScript library that you can use on your own web server, but CartoDB has implemented a Sandbox that allows non-programmers to deploy a story map with very little coding and without any web server infrastructure, at all. Odyssey.js uses a very simple text matkup language called Markdown.
http://cartodb.github.io/odyssey.js/


Three possibilities:
http://cartodb.github.io/odyssey.js/documentation/#the-odyssey-sandbox
sandbox: http://cartodb.github.io/odyssey.js/sandbox/sandbox.html

Templates control the overall structure and layout of your story. They define the position of your map and story elements and define the method by which your story will progress. We have developed three templates to get you started.

Slide template

The slide template acts like a Keynote or PowerPoint presentation. Your story is broken down into different states or slides, so you can go forward or backward just by clicking the arrows on the screen buttons or by pressing the forward/back arrows on your keyboard. This is perfect for stories that don’t have too much text and you want to highlight the map as the principal element.

See a live example (in the sandbox)

Scroll template

The scroll template moves based on when the viewer scrolls the page. As you scroll up or down, the story moves forward or backward. This template works really well with stories that have a lot of editorial content such as images and texts, and where the map adds more context to the story.

See a live example (in the sandbox)

Torque template

Use this template if your data is animated. This template adds triggers to your animated map so when reaching a certain point on the timeline your contextual information changes. This is perfect for adding extra information to animated stories. But it is more complex....

-------
best tools specially for students:
THE ODYSSEY SANDBOX
The Odyssey Sandbox allows you to link map changes and movements to different elements in a web document through the use of Markdown. We have included a small number of webpage templates to help you quickly create your stories.
Sandbox:

  1. Start a new history
  2. Publish your story
  3. Save your story

http://cartodb.github.io/odyssey.js/documentation/#advanced-use-of-the-sandbox

See the syntax of markdown : http://daringfireball.net/projects/markdown/syntax

Sharing your story map

Once you have created all the slides you are interested in putting into your Story Map, you are ready to share your work with the world. The Odyssey.js Sandbox allows you to do this in three ways:

1/Sharing with an URL or Embed code

Odyssey.js can export your Story Map directly to a site called http://bl.ocks.org/, which is just a platform for sharing and rendering JavaSript code, or give you an IFRAME code snippet to paste into your blog, or other website.


2/You can also download the code for your Story Map and host it on your own Web Server

3/ others

See this exemple:
http://mapninja.github.io/CartoDB_Odyssey_Tutorial_for_Story_Maps/

Training:
Each student was responsible for researching a location, writing the text and assembling the materials, writing the Markdown Code, etc to support a series of online map narratives about San Francisco
https://cartodb.github.io/training/special/stanford-odyssey.html

fund:
http://www.knightfoundation.org/articles/testable-moment-for-media-innovation
http://blog.vizzuality.com/
http://www.vizzuality.com/projects/global-forest-watch


questions
http://gis.stackexchange.com/search?q=odyssey.js
http://gis.stackexchange.com/questions/124043/using-odyssey-js-with-cartodb-js


storymap.js

open source (2014-now) but no sandbox
https://github.com/NUKnightLab/StoryMapJS

StoryMapJS is a simple tool to help you tell stories with maps. If you're not a programmer, you don't need to spend much time on the GitHub page—instead, go StoryMapJS:
https://storymap.knightlab.com/


choose Gigapixel if:
To preface the instructions, the gigapixel feature of StoryMap is not as easy to use as most of our other tools because it requires hosting a folder of images on a web server. If you are unable to serve your images and make them accessible through the web, you won't be able to use the gigapixel feature of StoryMap.
You'll start with a large image for your gigapixel project. It doesn't actually need to be a gigapixel image, but images you take with your phone won't be big enough to be interesting. You need to know the image width and height in pixels as part of starting a gigapixel StoryMap.
Once you have a large image, export it as tiles. Windows and Mac users can use the Zoomify Express app. Or, if you have Photoshop, you can use its "Zoomify" export feature. (show me how) More technically-minded users can use command-line tools such as ZoomifyImage or VIPS.
This is when you'll need to be able to put your image folder onto a web server. You'll use the base url of the image folder for your exported tiles to make your gigapixel StoryMap.
After you have your image tiles up on a server, go to make a new StoryMap and choose the "gigapixel" button. (). Give your new project a name and enter the base url of your image tile folder on the web. Then enter the image width and height mentioned above, and you're ready to tell your gigapixel story. 

some users:
http://ursilaa.tumblr.com/post/95926012537/understanding-storymap-js-101
medium

http://s3.amazonaws.com/uploads.knightlab.com/storymapjs/bf3baae30cab35dca6e1e3d208a86c1f/karpatyrocks/index.html (texte is not available)

If you want information on creating JSON with your own code and embedding it, see the "Advanced" documentation on the StoryMap website:
https://storymap.knightlab.com/advanced/

Some users/demo(s) : many story maps

storymap.js

https://storymap.knightlab.com/examples/aryas-journey/
https://storymap.knightlab.com/examples/bosch-garden/

odyssey.js


the best (pop-up and custom with cartDB import data):
1/
http://bl.ocks.org/anonymous/raw/409cb9de4c713e082dee/#0
http://mapninja.github.io/CartoDB_Odyssey_Tutorial_for_Story_Maps/
https://github.com/mapninja
2/
with popup text click and hover (and custom)
http://web.stanford.edu/~maples/maps/odyssey/odyssey.html


http://www.burdgis.com/cumberShaw/
http://www.burdgis.com/blog/archive/map-stories/

http://www.nydailynews.com/new-york/nyc-crime/bloody-weekend-19-injured-bullets-cops-arrest-2-article-1.1846552
-->http://multimedia.nydailynews.com/css/maps/48hours/index3.html?123456789000
http://multimedia.nydailynews.com/css/maps/shootings-2/index.html

The Voyage of the HMS Beagle:
http://bl.ocks.org/anonymous/raw/7d67c4ef3348192da613/

http://seeread.info/experiments/santiago/ (classic)


1/history of the wall (Berlin)
http://bl.ocks.org/namessanti/e7432a85159fca12978e
from this template:
http://bl.ocks.org/anonymous/f888598531665f34f864

2/ evolution of some lakes:
http://bl.ocks.org/auremoser/raw/d2e883314470768a07f8/
https://gist.github.com/auremoser/c644c9be4879498a429f

an introduction to odyssey.js:
https://gist.github.com/auremoser/c644c9be4879498a429f


3/special:
http://bl.ocks.org/anonymous/raw/2f1e9a5a74ceeb88e977/

4/classic (Français):
 https://gist.github.com/jonathanlurie/0b8785bc83b56693c089
-----

http://blockbuilder.org/search#text=odyssey.js

---
https://gist.github.com/lokal-profil/8427ce6a1acda3c34f15
Running odyssey.js with the md as an external file

----
https://carto.com/blog/odyssey-js-examples-in-the-wild/

http://lifewatch.inbo.be/blog/posts/tracking-eric.html
(bird, BIRD TRACKING, open data)
many mapping resources
https://gist.github.com/auremoser/da1b8fe8de23fe6365923b1a4d8f7b7d
For this project I chose CartoDB, a cloud platform that lets users build map applications in a very easy way. Their new open-source tool named Odyssey.js let me create “The story of James Rodriguez”. You can use the Odyssey sandbox or get the code straight-away. I felt it would be better to download the files and start to write my code using Aptana Studio (web application IDE).
http://www.aptana.com/
At this stage I had made changes to the code, so the next step would be find a place to keep my code safe and create a webpage to host my project. What to use? An easy question for me, since I have been meaning to take advantage of the huge benefits of Git for a long time, the open-source version control system (VCS). This would be the perfect time to do so.

I started from scratch, so the first thing I did was complete the TryGit offer by Code School and GitHub, an introductory free course makes up of 25 challenges to review the basic concepts of Git.
https://www.codeschool.com/courses/try-git

I joined GitHub but also after grasping some Git fundamentals from Pro Git book, a practical tutorial with examples and explanations by Scott Chacon.
https://git-scm.com/book/en/v2

I installed Git on Mac, set it up in my Terminal application with the git config command and fortunately I could create my first repository on GitHub.
I would say the most difficult part for me was move and commit my repository files to a webpage, but thanks to the GitHub tutorial I could generate a proper project site.
https://pages.github.com/

----project clhenrick

http://clhenrick.github.io/BushwickCommunityMap/
https://github.com/clhenrick/BushwickCommunityMap

http://clhenrick.github.io/data/web-scraping/node/js/web-mapping/flickr-api/cartodb/2015/05/29/scraping-photo-metadata/

While each photo was taken with geo location tracking enabled, there was some poor management of the photographs collected by various teams. Granted the photos were logically grouped by census tract in folders on Google Drive, yet no unified naming convention was used to name the photographs.
For example, a sensible naming convention could have been something like:

<building-number>-<street>-<census-tract>.jpg

The way in which the Urban Ecologies students then mapped the photos after they were collected was using Google Earth to produce a KML file of the photos’ locations. The problem with this approach is that for some reason unknown to me, the KML they produced only has ~700 features while there are a total of 1008 photos. I didn’t learn this until after the Urban Ecologies group shared then survey data, KML, and photos with me.

To make working with the photos easier I first uploaded all 1008 photos to Flickr which genorously gives all users a whole terabyte of free storage. I then used the Flickr API to grab the URLs and title for each uploaded photo and store them in a JSON file. For some reason I wasn’t able to see the geo data for the photos using this method which definitely would have helped save some time.

My original solution was to merge all the layers in the KML file, then convert it to a GeoJSON format and then join it to the Flickr JSON data using the joiner module for Node JS. Yet I soon realized this was not a good strategy as the KML file was missing locations for ~300 photos.

Thankfully one last solution occured to me; I could scrape the Exif metadata from the photos which includes latitude and longitude coordinates (only if geolocation was enabled from the camera).

The question was, how to do this?
Node JS to the Rescue
I ended up finding a Node JS library that worked pretty well called Exif. This module allows to retreive the Exif metadata in a JSON format. From here I wrote a script that iterates over the Exif data from all of the photos and outputs a GeoJSON file which I was then able to join to the Flickr JSON data. I ended up doing the join in CartoDB because they make it so easy to do.

The end result is that I successfully geocoded 1006 out of 1008 of the photos so that they can now be added to the Bushwick Community Map.

--------

gist.github.com and bl.ocks.org

For example, if your Gist URL is:

https://gist.github.com/mbostock/1353700

Replace “gist.github.com” with “bl.ocks.org” in the URL to view it:

https://bl.ocks.org/mbostock/1353700

The main source for your example is in index.html. This file can contain relative links to other files in your Gist, such as images, scripts or stylesheets. And of course you can use absolute links, such as CDN-hosted D3, jQuery or Leaflet. To explain your example, add a README.md written in Markdown. (You can omit the index.html if you just want to write, too.)

Customize the appearance of your Block by adding a .block YAML configuration. The following options are supported:

license - a supported SPDX license code
height - the iframe height in pixels; defaults to 500
scrolling - yes if the iframe should scroll; defaults to no
border - no if the iframe should not have a border; defaults to yes
To add a thumbnail preview, add a 230×120 thumbnail.png to your Gist. For social media, you can also add a larger 960×500 preview.png or preview.jpg.


Ref:
http://bl.ocks.org/-/about

---------
PS:
"histoire et géo"
réalisé en 2012, un blog avec mapping sur l'histoire de la révolte en Jamaique de 1760-1761 par Charles Warren (Professor of History and Professor of African and African-American Studies), y compris un mode diaporama (que du texte et des trajets des révoltés):
http://revolt.axismaps.com/map/